Chart-Plotly/lib/Chart/Plotly.pm
package Chart::Plotly;
use strict;
use warnings;
use utf8;
use Exporter 'import';
use vars qw(@EXPORT_OK);
@EXPORT_OK = qw(show_plot);
use JSON;
use Params::Validate qw(:all);
use Text::Template;
use Module::Load;
use Ref::Util;
use HTML::Show;
use UUID::Tiny ':std';
use File::ShareDir;
use Path::Tiny;
our $VERSION = '0.042'; # VERSION
# ABSTRACT: Generate html/javascript charts from perl data using javascript library plotly.js
sub render_full_html {
## no critic
my %params = validate( @_, { data => { type => ARRAYREF | OBJECT }, } );
## use critic
my $data = $params{'data'};
my $chart_id = create_uuid_as_string(UUID_TIME);
my $html;
if ( Ref::Util::is_blessed_ref($data) && $data->isa('Chart::Plotly::Plot') ) {
$html = _render_html_wrap( $data->html( div_id => $chart_id ) );
} else {
$html = _render_html_wrap( _render_cell( _process_data($data), $chart_id ) );
}
return $html;
}
sub _render_html_wrap {
my $body = shift;
my $html_begin = <<'HTML_BEGIN';
<!DOCTYPE html>
<head>
<meta charset="utf-8" />
</head>
<body>
HTML_BEGIN
my $html_end = <<'HTML_END';
</body>
</html>
HTML_END
return $html_begin . $body . $html_end;
}
sub _render_cell {
my $data_string = shift();
my $chart_id = shift() // create_uuid_as_string(UUID_TIME);
my $layout = shift();
my $config = shift();
my $extra = shift() // { load_plotly_using_script_tag => 1 };
if ( defined $layout ) {
$layout = "," . $layout;
}
if ( defined $config ) {
$config = "," . $config;
}
my $load_plotly = _load_plotly( ${$extra}{'load_plotly_using_script_tag'} );
my $template = <<'TEMPLATE';
<div id="{$chart_id}"></div>
{$load_plotly}
<script>
Plotly.{$plotlyjs_plot_function}(document.getElementById('{$chart_id}'),{$data} {$layout} {$config});
</script>
TEMPLATE
my $template_variables = { data => $data_string,
chart_id => $chart_id,
load_plotly => $load_plotly,
plotlyjs_plot_function => plotlyjs_plot_function(),
defined $layout ? ( layout => $layout ) : (),
defined $config ? ( config => $config ) : (),
};
return Text::Template::fill_in_string( $template, HASH => $template_variables );
}
sub _process_data {
my $data = shift;
my $json_formatter = JSON->new->allow_blessed(1)->convert_blessed(1);
local *PDL::TO_JSON = sub { $_[0]->unpdl };
if ( Ref::Util::is_blessed_ref($data) ) {
my $adapter_name = 'Chart::Plotly::Adapter::' . ref $data;
eval {
load $adapter_name;
my $adapter = $adapter_name->new( data => $data );
$data = $adapter->traces();
};
if ($@) {
warn 'Cannot load adapter: ' . $adapter_name . '. ' . $@;
}
}
my $data_string = $json_formatter->encode($data);
return $data_string;
}
sub _load_plotly {
my $how_to_load = shift;
if ($how_to_load) {
if ( $how_to_load eq "1" || $how_to_load eq 'cdn' ) {
return '<script src="https://cdn.plot.ly/plotly-' . plotlyjs_version() . '.min.js"></script>';
} elsif ( $how_to_load eq 'embed' ) {
my $minified_plotly = File::ShareDir::dist_file( 'Chart-Plotly', 'plotly.js/plotly.min.js' );
return '<script>' . Path::Tiny::path($minified_plotly)->slurp . '</script>';
} elsif ( $how_to_load eq 'module_dist' ) {
my $minified_plotly = File::ShareDir::dist_file( 'Chart-Plotly', 'plotly.js/plotly.min.js' );
return '<script src="file://' . $minified_plotly . '"></script>';
}
} else {
return '';
}
}
sub html_plot {
my @data_to_plot = @_;
my $rendered_cells = "";
for my $data (@data_to_plot) {
my $id = create_uuid_as_string(UUID_TIME);
if ( Ref::Util::is_blessed_ref($data) && $data->isa('Chart::Plotly::Plot') ) {
$rendered_cells .= $data->html( div_id => $id );
} else {
$rendered_cells .= _render_cell( _process_data($data), $id );
}
}
return _render_html_wrap($rendered_cells);
}
sub show_plot {
HTML::Show::show( html_plot(@_) );
}
sub plotlyjs_version {
return '2.14.0'; # plotlyjs_version_tag
}
sub plotlyjs_plot_function {
return 'react';
}
sub plotlyjs_plot_function_parameters {
return qw(div data layout config);
}
1;
__END__
=pod
=encoding utf-8
=head1 NAME
Chart::Plotly - Generate html/javascript charts from perl data using javascript library plotly.js
=head1 VERSION
version 0.042
=head1 SYNOPSIS
use Chart::Plotly 'show_plot';
my $data = { x => [ 1 .. 10 ],
mode => 'markers',
type => 'scatter'
};
$data->{'y'} = [ map { rand 10 } @{ $data->{'x'} } ];
show_plot([$data]);
use aliased 'Chart::Plotly::Trace::Scattergl';
my $big_array = [ 1 .. 10000 ];
my $scattergl = Scattergl->new( x => $big_array, y => [ map { rand 100 } @$big_array ] );
show_plot([$scattergl]);
use Chart::Plotly qw(show_plot);
use PDL;
use aliased 'Chart::Plotly::Trace::Surface';
my $size = 25;
my $x = ( xvals zeroes $size+ 1, $size + 1 ) / $size;
my $y = ( yvals zeroes $size+ 1, $size + 1 ) / $size;
my $z = 0.5 + 0.5 * ( sin( $x * 6.3 ) * sin( $y * 6.3 ) )**3; # Bumps
my $surface = Surface->new( x => $x, y => $y, z => $z );
show_plot([$surface]);
use PDL::Math;
my $bessel_size = 50;
my $bessel = Surface->new(
x => xvals($bessel_size),
y => xvals($bessel_size),
z => bessj0( rvals( zeroes( $bessel_size, $bessel_size ) ) / 2 )
);
show_plot([$bessel]);
=head1 DESCRIPTION
Generate html/javascript charts from perl data using javascript library plotly.js. The result
is a file that you could see in your favourite browser.
=for markdown [](https://travis-ci.org/pablrod/p5-Chart-Plotly)
[](https://ci.appveyor.com/project/pablrod/p5-chart-plotly/branch/master)
Example screenshot of plot generated with examples/anscombe.pl:
=for HTML <p>
<img src="https://raw.githubusercontent.com/pablrod/p5-Chart-Plotly/master/examples/anscombe.png" alt="Anscombe's quartet plotted with plotly">
</p>
=for markdown 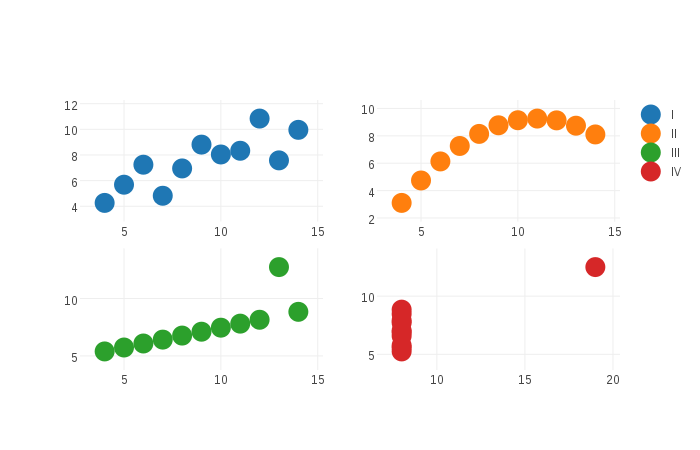
Example screenshot of plots generated with examples/traces/*.pl:
=for HTML <p>
<img src="https://raw.githubusercontent.com/pablrod/p5-Chart-Plotly/master/examples/montage_all_traces.png" alt="Montage of all examples">
</p>
=for markdown 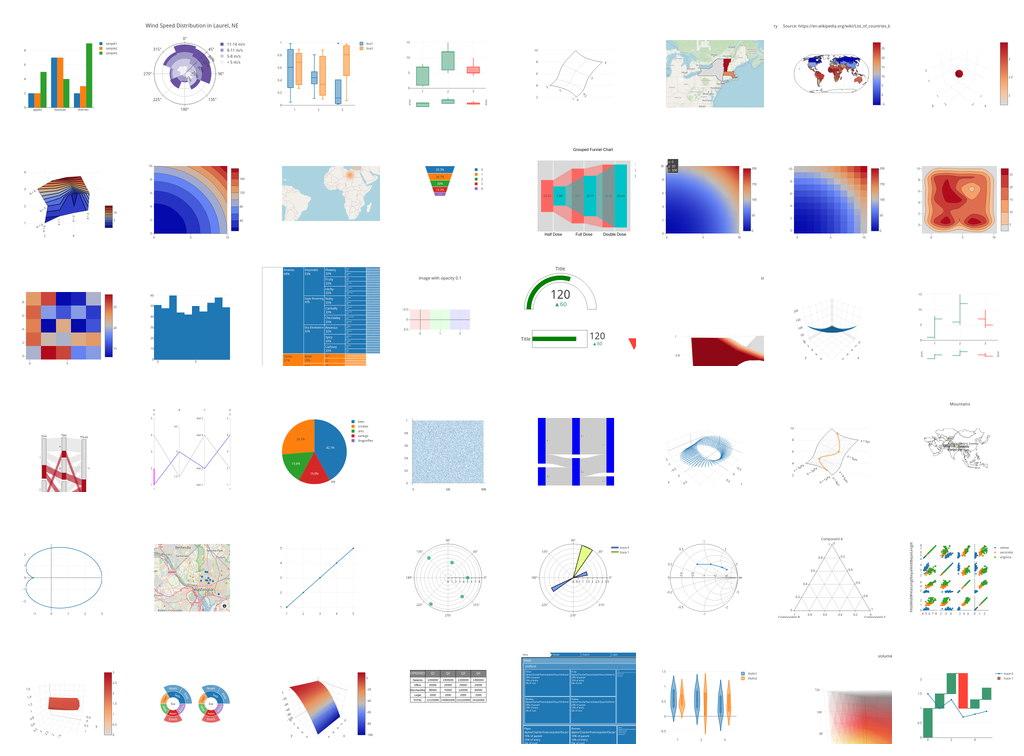
The API is subject to changes.
=head1 FUNCTIONS
=head2 render_full_html
=head3 Parameters
=over
=item * data:
Data to be represented. It could be:
=over
=item Perl data structure of the json expected by plotly.js: L<http://plot.ly/javascript/reference/> (this data would be serialized to JSON)
=item Array ref of objects of type Chart::Plotly::Trace::*
=item Anything that could be serialized to JSON with the json expected by plotly.js
=item Object that could be adapted using Chart::Plotly::Adapter::*
=back
=back
=head2 html_plot
Return the html for the plot or plots
=head3 Parameters
Data to be represented. The format is the same as the parameter data in render_full_html. Accepts multiple traces/plots/objects.
=head2 show_plot
Opens the plot or plots in a browser locally
=head3 Parameters
Data to be represented. The format is the same as the parameter data in render_full_html. Accepts multiple traces/plots/objects.
=head2 plotlyjs_version
Returns the version of plotly.js using in this version of the perl module as a string
=head2 plotlyjs_plot_function
Returns the name of function of plotly.js used in this version of the perl module to draw plots
=head2 plotlyjs_plot_function_parameters
Returns the function parameters of the function of plotly.js used in this version of the perl module to draw plots as a list of strings
=head1 BUGS
Please report any bugs or feature requests via github: L<https://github.com/pablrod/p5-Chart-Plotly/issues>
=head1 DISCLAIMER
This is an unofficial Plotly Perl module. Currently I'm not affiliated in any way with Plotly.
But I think plotly.js is a great library and I want to use it with perl.
If you like plotly.js please consider supporting them purchasing a pro subscription: L<https://plot.ly/products/cloud/>
=head1 AUTHOR
Pablo Rodríguez González <pablo.rodriguez.gonzalez@gmail.com>
=head1 COPYRIGHT AND LICENSE
This software is Copyright (c) 2022 by Pablo Rodríguez González.
This is free software, licensed under:
The MIT (X11) License
=head1 CONTRIBUTORS
=for stopwords Roy Storey stphnlyd weatherwax
=over 4
=item *
Roy Storey <kiwiroy@users.noreply.github.com>
=item *
stphnlyd <stephanloyd9@gmail.com>
=item *
weatherwax <s.g.lobo@hotmail.com>
=back
=cut