Chart-Plotly/lib/Chart/Plotly/Trace/Carpet.pm
package Chart::Plotly::Trace::Carpet;
use Moose;
use MooseX::ExtraArgs;
use Moose::Util::TypeConstraints qw(enum union);
if ( !defined Moose::Util::TypeConstraints::find_type_constraint('PDL') ) {
Moose::Util::TypeConstraints::type('PDL');
}
use Chart::Plotly::Trace::Carpet::Aaxis;
use Chart::Plotly::Trace::Carpet::Baxis;
use Chart::Plotly::Trace::Carpet::Font;
use Chart::Plotly::Trace::Carpet::Legendgrouptitle;
use Chart::Plotly::Trace::Carpet::Stream;
our $VERSION = '0.042'; # VERSION
# ABSTRACT: The data describing carpet axis layout is set in `y` and (optionally) also `x`. If only `y` is present, `x` the plot is interpreted as a cheater plot and is filled in using the `y` values. `x` and `y` may either be 2D arrays matching with each dimension matching that of `a` and `b`, or they may be 1D arrays with total length equal to that of `a` and `b`.
sub TO_JSON {
my $self = shift;
my $extra_args = $self->extra_args // {};
my $meta = $self->meta;
my %hash = %$self;
for my $name ( sort keys %hash ) {
my $attr = $meta->get_attribute($name);
if ( defined $attr ) {
my $value = $hash{$name};
my $type = $attr->type_constraint;
if ( $type && $type->equals('Bool') ) {
$hash{$name} = $value ? \1 : \0;
}
}
}
my $plotly_meta = delete $hash{'pmeta'};
if ( defined $plotly_meta ) {
$hash{'meta'} = $plotly_meta;
}
%hash = ( %hash, %$extra_args );
delete $hash{'extra_args'};
if ( $self->can('type') && ( !defined $hash{'type'} ) ) {
$hash{type} = $self->type();
}
return \%hash;
}
sub type {
my @components = split( /::/, __PACKAGE__ );
return lc( $components[-1] );
}
has a => ( is => "rw",
isa => "ArrayRef|PDL",
documentation => "An array containing values of the first parameter value",
);
has a0 => (
is => "rw",
isa => "Num",
documentation =>
"Alternate to `a`. Builds a linear space of a coordinates. Use with `da` where `a0` is the starting coordinate and `da` the step.",
);
has aaxis => ( is => "rw",
isa => "Maybe[HashRef]|Chart::Plotly::Trace::Carpet::Aaxis", );
has asrc => ( is => "rw",
isa => "Str",
documentation => "Sets the source reference on Chart Studio Cloud for `a`.",
);
has b => ( is => "rw",
isa => "ArrayRef|PDL",
documentation => "A two dimensional array of y coordinates at each carpet point.",
);
has b0 => (
is => "rw",
isa => "Num",
documentation =>
"Alternate to `b`. Builds a linear space of a coordinates. Use with `db` where `b0` is the starting coordinate and `db` the step.",
);
has baxis => ( is => "rw",
isa => "Maybe[HashRef]|Chart::Plotly::Trace::Carpet::Baxis", );
has bsrc => ( is => "rw",
isa => "Str",
documentation => "Sets the source reference on Chart Studio Cloud for `b`.",
);
has carpet => (
is => "rw",
isa => "Str",
documentation =>
"An identifier for this carpet, so that `scattercarpet` and `contourcarpet` traces can specify a carpet plot on which they lie",
);
has cheaterslope => (
is => "rw",
isa => "Num",
documentation =>
"The shift applied to each successive row of data in creating a cheater plot. Only used if `x` is been omitted.",
);
has color => (
is => "rw",
isa => "Str",
documentation =>
"Sets default for all colors associated with this axis all at once: line, font, tick, and grid colors. Grid color is lightened by blending this with the plot background Individual pieces can override this.",
);
has customdata => (
is => "rw",
isa => "ArrayRef|PDL",
documentation =>
"Assigns extra data each datum. This may be useful when listening to hover, click and selection events. Note that, *scatter* traces also appends customdata items in the markers DOM elements",
);
has customdatasrc => ( is => "rw",
isa => "Str",
documentation => "Sets the source reference on Chart Studio Cloud for `customdata`.",
);
has da => ( is => "rw",
isa => "Num",
documentation => "Sets the a coordinate step. See `a0` for more info.",
);
has db => ( is => "rw",
isa => "Num",
documentation => "Sets the b coordinate step. See `b0` for more info.",
);
has font => ( is => "rw",
isa => "Maybe[HashRef]|Chart::Plotly::Trace::Carpet::Font", );
has ids => (
is => "rw",
isa => "ArrayRef|PDL",
documentation =>
"Assigns id labels to each datum. These ids for object constancy of data points during animation. Should be an array of strings, not numbers or any other type.",
);
has idssrc => ( is => "rw",
isa => "Str",
documentation => "Sets the source reference on Chart Studio Cloud for `ids`.",
);
has legendgrouptitle => ( is => "rw",
isa => "Maybe[HashRef]|Chart::Plotly::Trace::Carpet::Legendgrouptitle", );
has legendrank => (
is => "rw",
isa => "Num",
documentation =>
"Sets the legend rank for this trace. Items and groups with smaller ranks are presented on top/left side while with `*reversed* `legend.traceorder` they are on bottom/right side. The default legendrank is 1000, so that you can use ranks less than 1000 to place certain items before all unranked items, and ranks greater than 1000 to go after all unranked items.",
);
has pmeta => (
is => "rw",
isa => "Any|ArrayRef[Any]",
documentation =>
"Assigns extra meta information associated with this trace that can be used in various text attributes. Attributes such as trace `name`, graph, axis and colorbar `title.text`, annotation `text` `rangeselector`, `updatemenues` and `sliders` `label` text all support `meta`. To access the trace `meta` values in an attribute in the same trace, simply use `%{meta[i]}` where `i` is the index or key of the `meta` item in question. To access trace `meta` in layout attributes, use `%{data[n[.meta[i]}` where `i` is the index or key of the `meta` and `n` is the trace index.",
);
has metasrc => ( is => "rw",
isa => "Str",
documentation => "Sets the source reference on Chart Studio Cloud for `meta`.",
);
has name => ( is => "rw",
isa => "Str",
documentation => "Sets the trace name. The trace name appear as the legend item and on hover.",
);
has opacity => ( is => "rw",
isa => "Num",
documentation => "Sets the opacity of the trace.",
);
has stream => ( is => "rw",
isa => "Maybe[HashRef]|Chart::Plotly::Trace::Carpet::Stream", );
has uid => (
is => "rw",
isa => "Str",
documentation =>
"Assign an id to this trace, Use this to provide object constancy between traces during animations and transitions.",
);
has uirevision => (
is => "rw",
isa => "Any",
documentation =>
"Controls persistence of some user-driven changes to the trace: `constraintrange` in `parcoords` traces, as well as some `editable: true` modifications such as `name` and `colorbar.title`. Defaults to `layout.uirevision`. Note that other user-driven trace attribute changes are controlled by `layout` attributes: `trace.visible` is controlled by `layout.legend.uirevision`, `selectedpoints` is controlled by `layout.selectionrevision`, and `colorbar.(x|y)` (accessible with `config: {editable: true}`) is controlled by `layout.editrevision`. Trace changes are tracked by `uid`, which only falls back on trace index if no `uid` is provided. So if your app can add/remove traces before the end of the `data` array, such that the same trace has a different index, you can still preserve user-driven changes if you give each trace a `uid` that stays with it as it moves.",
);
has visible => (
is => "rw",
documentation =>
"Determines whether or not this trace is visible. If *legendonly*, the trace is not drawn, but can appear as a legend item (provided that the legend itself is visible).",
);
has x => (
is => "rw",
isa => "ArrayRef|PDL",
documentation =>
"A two dimensional array of x coordinates at each carpet point. If omitted, the plot is a cheater plot and the xaxis is hidden by default.",
);
has xaxis => (
is => "rw",
documentation =>
"Sets a reference between this trace's x coordinates and a 2D cartesian x axis. If *x* (the default value), the x coordinates refer to `layout.xaxis`. If *x2*, the x coordinates refer to `layout.xaxis2`, and so on.",
);
has xsrc => ( is => "rw",
isa => "Str",
documentation => "Sets the source reference on Chart Studio Cloud for `x`.",
);
has y => ( is => "rw",
isa => "ArrayRef|PDL",
documentation => "A two dimensional array of y coordinates at each carpet point.",
);
has yaxis => (
is => "rw",
documentation =>
"Sets a reference between this trace's y coordinates and a 2D cartesian y axis. If *y* (the default value), the y coordinates refer to `layout.yaxis`. If *y2*, the y coordinates refer to `layout.yaxis2`, and so on.",
);
has ysrc => ( is => "rw",
isa => "Str",
documentation => "Sets the source reference on Chart Studio Cloud for `y`.",
);
__PACKAGE__->meta->make_immutable();
1;
__END__
=pod
=encoding utf-8
=head1 NAME
Chart::Plotly::Trace::Carpet - The data describing carpet axis layout is set in `y` and (optionally) also `x`. If only `y` is present, `x` the plot is interpreted as a cheater plot and is filled in using the `y` values. `x` and `y` may either be 2D arrays matching with each dimension matching that of `a` and `b`, or they may be 1D arrays with total length equal to that of `a` and `b`.
=head1 VERSION
version 0.042
=head1 SYNOPSIS
use Chart::Plotly qw(show_plot);
use Chart::Plotly::Trace::Carpet;
# Example data from: https://plot.ly/javascript/carpet-plot/#add-parameter-values
my $carpet = Chart::Plotly::Trace::Carpet->new(
a => [ 4, 4, 4, 4.5, 4.5, 4.5, 5, 5, 5, 6, 6, 6 ],
b => [ 1, 2, 3, 1, 2, 3, 1, 2, 3, 1, 2, 3 ],
y => [ 2, 3.5, 4, 3, 4.5, 5, 5.5, 6.5, 7.5, 8, 8.5, 10 ]);
show_plot([ $carpet ]);
=head1 DESCRIPTION
The data describing carpet axis layout is set in `y` and (optionally) also `x`. If only `y` is present, `x` the plot is interpreted as a cheater plot and is filled in using the `y` values. `x` and `y` may either be 2D arrays matching with each dimension matching that of `a` and `b`, or they may be 1D arrays with total length equal to that of `a` and `b`.
Screenshot of the above example:
=for HTML <p>
<img src="https://raw.githubusercontent.com/pablrod/p5-Chart-Plotly/master/examples/traces/carpet.png" alt="Screenshot of the above example">
</p>
=for markdown 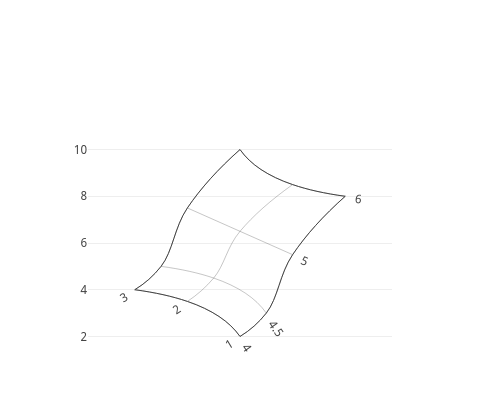
=for HTML <p>
<iframe src="https://raw.githubusercontent.com/pablrod/p5-Chart-Plotly/master/examples/traces/carpet.html" style="border:none;" width="80%" height="520"></iframe>
</p>
This file has been autogenerated from the official plotly.js source.
If you like Plotly, please support them: L<https://plot.ly/>
Open source announcement: L<https://plot.ly/javascript/open-source-announcement/>
Full reference: L<https://plot.ly/javascript/reference/#carpet>
=head1 DISCLAIMER
This is an unofficial Plotly Perl module. Currently I'm not affiliated in any way with Plotly.
But I think plotly.js is a great library and I want to use it with perl.
=head1 METHODS
=head2 TO_JSON
Serialize the trace to JSON. This method should be called only by L<JSON> serializer.
=head2 type
Trace type.
=head1 ATTRIBUTES
=over
=item * a
An array containing values of the first parameter value
=item * a0
Alternate to `a`. Builds a linear space of a coordinates. Use with `da` where `a0` is the starting coordinate and `da` the step.
=item * aaxis
=item * asrc
Sets the source reference on Chart Studio Cloud for `a`.
=item * b
A two dimensional array of y coordinates at each carpet point.
=item * b0
Alternate to `b`. Builds a linear space of a coordinates. Use with `db` where `b0` is the starting coordinate and `db` the step.
=item * baxis
=item * bsrc
Sets the source reference on Chart Studio Cloud for `b`.
=item * carpet
An identifier for this carpet, so that `scattercarpet` and `contourcarpet` traces can specify a carpet plot on which they lie
=item * cheaterslope
The shift applied to each successive row of data in creating a cheater plot. Only used if `x` is been omitted.
=item * color
Sets default for all colors associated with this axis all at once: line, font, tick, and grid colors. Grid color is lightened by blending this with the plot background Individual pieces can override this.
=item * customdata
Assigns extra data each datum. This may be useful when listening to hover, click and selection events. Note that, *scatter* traces also appends customdata items in the markers DOM elements
=item * customdatasrc
Sets the source reference on Chart Studio Cloud for `customdata`.
=item * da
Sets the a coordinate step. See `a0` for more info.
=item * db
Sets the b coordinate step. See `b0` for more info.
=item * font
=item * ids
Assigns id labels to each datum. These ids for object constancy of data points during animation. Should be an array of strings, not numbers or any other type.
=item * idssrc
Sets the source reference on Chart Studio Cloud for `ids`.
=item * legendgrouptitle
=item * legendrank
Sets the legend rank for this trace. Items and groups with smaller ranks are presented on top/left side while with `*reversed* `legend.traceorder` they are on bottom/right side. The default legendrank is 1000, so that you can use ranks less than 1000 to place certain items before all unranked items, and ranks greater than 1000 to go after all unranked items.
=item * pmeta
Assigns extra meta information associated with this trace that can be used in various text attributes. Attributes such as trace `name`, graph, axis and colorbar `title.text`, annotation `text` `rangeselector`, `updatemenues` and `sliders` `label` text all support `meta`. To access the trace `meta` values in an attribute in the same trace, simply use `%{meta[i]}` where `i` is the index or key of the `meta` item in question. To access trace `meta` in layout attributes, use `%{data[n[.meta[i]}` where `i` is the index or key of the `meta` and `n` is the trace index.
=item * metasrc
Sets the source reference on Chart Studio Cloud for `meta`.
=item * name
Sets the trace name. The trace name appear as the legend item and on hover.
=item * opacity
Sets the opacity of the trace.
=item * stream
=item * uid
Assign an id to this trace, Use this to provide object constancy between traces during animations and transitions.
=item * uirevision
Controls persistence of some user-driven changes to the trace: `constraintrange` in `parcoords` traces, as well as some `editable: true` modifications such as `name` and `colorbar.title`. Defaults to `layout.uirevision`. Note that other user-driven trace attribute changes are controlled by `layout` attributes: `trace.visible` is controlled by `layout.legend.uirevision`, `selectedpoints` is controlled by `layout.selectionrevision`, and `colorbar.(x|y)` (accessible with `config: {editable: true}`) is controlled by `layout.editrevision`. Trace changes are tracked by `uid`, which only falls back on trace index if no `uid` is provided. So if your app can add/remove traces before the end of the `data` array, such that the same trace has a different index, you can still preserve user-driven changes if you give each trace a `uid` that stays with it as it moves.
=item * visible
Determines whether or not this trace is visible. If *legendonly*, the trace is not drawn, but can appear as a legend item (provided that the legend itself is visible).
=item * x
A two dimensional array of x coordinates at each carpet point. If omitted, the plot is a cheater plot and the xaxis is hidden by default.
=item * xaxis
Sets a reference between this trace's x coordinates and a 2D cartesian x axis. If *x* (the default value), the x coordinates refer to `layout.xaxis`. If *x2*, the x coordinates refer to `layout.xaxis2`, and so on.
=item * xsrc
Sets the source reference on Chart Studio Cloud for `x`.
=item * y
A two dimensional array of y coordinates at each carpet point.
=item * yaxis
Sets a reference between this trace's y coordinates and a 2D cartesian y axis. If *y* (the default value), the y coordinates refer to `layout.yaxis`. If *y2*, the y coordinates refer to `layout.yaxis2`, and so on.
=item * ysrc
Sets the source reference on Chart Studio Cloud for `y`.
=back
=head1 AUTHOR
Pablo Rodríguez González <pablo.rodriguez.gonzalez@gmail.com>
=head1 COPYRIGHT AND LICENSE
This software is Copyright (c) 2022 by Pablo Rodríguez González.
This is free software, licensed under:
The MIT (X11) License
=cut