Chart-Plotly/lib/Chart/Plotly/Trace/Densitymapbox.pm
package Chart::Plotly::Trace::Densitymapbox;
use Moose;
use MooseX::ExtraArgs;
use Moose::Util::TypeConstraints qw(enum union);
if ( !defined Moose::Util::TypeConstraints::find_type_constraint('PDL') ) {
Moose::Util::TypeConstraints::type('PDL');
}
use Chart::Plotly::Trace::Densitymapbox::Colorbar;
use Chart::Plotly::Trace::Densitymapbox::Hoverlabel;
use Chart::Plotly::Trace::Densitymapbox::Legendgrouptitle;
use Chart::Plotly::Trace::Densitymapbox::Stream;
use Chart::Plotly::Trace::Densitymapbox::Transform;
our $VERSION = '0.042'; # VERSION
# ABSTRACT: Draws a bivariate kernel density estimation with a Gaussian kernel from `lon` and `lat` coordinates and optional `z` values using a colorscale.
sub TO_JSON {
my $self = shift;
my $extra_args = $self->extra_args // {};
my $meta = $self->meta;
my %hash = %$self;
for my $name ( sort keys %hash ) {
my $attr = $meta->get_attribute($name);
if ( defined $attr ) {
my $value = $hash{$name};
my $type = $attr->type_constraint;
if ( $type && $type->equals('Bool') ) {
$hash{$name} = $value ? \1 : \0;
}
}
}
my $plotly_meta = delete $hash{'pmeta'};
if ( defined $plotly_meta ) {
$hash{'meta'} = $plotly_meta;
}
%hash = ( %hash, %$extra_args );
delete $hash{'extra_args'};
if ( $self->can('type') && ( !defined $hash{'type'} ) ) {
$hash{type} = $self->type();
}
return \%hash;
}
sub type {
my @components = split( /::/, __PACKAGE__ );
return lc( $components[-1] );
}
has autocolorscale => (
is => "rw",
isa => "Bool",
documentation =>
"Determines whether the colorscale is a default palette (`autocolorscale: true`) or the palette determined by `colorscale`. In case `colorscale` is unspecified or `autocolorscale` is true, the default palette will be chosen according to whether numbers in the `color` array are all positive, all negative or mixed.",
);
has below => (
is => "rw",
isa => "Str",
documentation =>
"Determines if the densitymapbox trace will be inserted before the layer with the specified ID. By default, densitymapbox traces are placed below the first layer of type symbol If set to '', the layer will be inserted above every existing layer.",
);
has coloraxis => (
is => "rw",
documentation =>
"Sets a reference to a shared color axis. References to these shared color axes are *coloraxis*, *coloraxis2*, *coloraxis3*, etc. Settings for these shared color axes are set in the layout, under `layout.coloraxis`, `layout.coloraxis2`, etc. Note that multiple color scales can be linked to the same color axis.",
);
has colorbar => ( is => "rw",
isa => "Maybe[HashRef]|Chart::Plotly::Trace::Densitymapbox::Colorbar", );
has colorscale => (
is => "rw",
documentation =>
"Sets the colorscale. The colorscale must be an array containing arrays mapping a normalized value to an rgb, rgba, hex, hsl, hsv, or named color string. At minimum, a mapping for the lowest (0) and highest (1) values are required. For example, `[[0, 'rgb(0,0,255)'], [1, 'rgb(255,0,0)']]`. To control the bounds of the colorscale in color space, use `zmin` and `zmax`. Alternatively, `colorscale` may be a palette name string of the following list: Blackbody,Bluered,Blues,Cividis,Earth,Electric,Greens,Greys,Hot,Jet,Picnic,Portland,Rainbow,RdBu,Reds,Viridis,YlGnBu,YlOrRd.",
);
has customdata => (
is => "rw",
isa => "ArrayRef|PDL",
documentation =>
"Assigns extra data each datum. This may be useful when listening to hover, click and selection events. Note that, *scatter* traces also appends customdata items in the markers DOM elements",
);
has customdatasrc => ( is => "rw",
isa => "Str",
documentation => "Sets the source reference on Chart Studio Cloud for `customdata`.",
);
has hoverinfo => (
is => "rw",
isa => "Str|ArrayRef[Str]",
documentation =>
"Determines which trace information appear on hover. If `none` or `skip` are set, no information is displayed upon hovering. But, if `none` is set, click and hover events are still fired.",
);
has hoverinfosrc => ( is => "rw",
isa => "Str",
documentation => "Sets the source reference on Chart Studio Cloud for `hoverinfo`.",
);
has hoverlabel => ( is => "rw",
isa => "Maybe[HashRef]|Chart::Plotly::Trace::Densitymapbox::Hoverlabel", );
has hovertemplate => (
is => "rw",
isa => "Str|ArrayRef[Str]",
documentation =>
"Template string used for rendering the information that appear on hover box. Note that this will override `hoverinfo`. Variables are inserted using %{variable}, for example \"y: %{y}\" as well as %{xother}, {%_xother}, {%_xother_}, {%xother_}. When showing info for several points, *xother* will be added to those with different x positions from the first point. An underscore before or after *(x|y)other* will add a space on that side, only when this field is shown. Numbers are formatted using d3-format's syntax %{variable:d3-format}, for example \"Price: %{y:\$.2f}\". https://github.com/d3/d3-format/tree/v1.4.5#d3-format for details on the formatting syntax. Dates are formatted using d3-time-format's syntax %{variable|d3-time-format}, for example \"Day: %{2019-01-01|%A}\". https://github.com/d3/d3-time-format/tree/v2.2.3#locale_format for details on the date formatting syntax. The variables available in `hovertemplate` are the ones emitted as event data described at this link https://plotly.com/javascript/plotlyjs-events/#event-data. Additionally, every attributes that can be specified per-point (the ones that are `arrayOk: true`) are available. Anything contained in tag `<extra>` is displayed in the secondary box, for example \"<extra>{fullData.name}</extra>\". To hide the secondary box completely, use an empty tag `<extra></extra>`.",
);
has hovertemplatesrc => ( is => "rw",
isa => "Str",
documentation => "Sets the source reference on Chart Studio Cloud for `hovertemplate`.",
);
has hovertext => (
is => "rw",
isa => "Str|ArrayRef[Str]",
documentation =>
"Sets hover text elements associated with each (lon,lat) pair If a single string, the same string appears over all the data points. If an array of string, the items are mapped in order to the this trace's (lon,lat) coordinates. To be seen, trace `hoverinfo` must contain a *text* flag.",
);
has hovertextsrc => ( is => "rw",
isa => "Str",
documentation => "Sets the source reference on Chart Studio Cloud for `hovertext`.",
);
has ids => (
is => "rw",
isa => "ArrayRef|PDL",
documentation =>
"Assigns id labels to each datum. These ids for object constancy of data points during animation. Should be an array of strings, not numbers or any other type.",
);
has idssrc => ( is => "rw",
isa => "Str",
documentation => "Sets the source reference on Chart Studio Cloud for `ids`.",
);
has lat => ( is => "rw",
isa => "ArrayRef|PDL",
documentation => "Sets the latitude coordinates (in degrees North).",
);
has latsrc => ( is => "rw",
isa => "Str",
documentation => "Sets the source reference on Chart Studio Cloud for `lat`.",
);
has legendgroup => (
is => "rw",
isa => "Str",
documentation =>
"Sets the legend group for this trace. Traces part of the same legend group hide/show at the same time when toggling legend items.",
);
has legendgrouptitle => ( is => "rw",
isa => "Maybe[HashRef]|Chart::Plotly::Trace::Densitymapbox::Legendgrouptitle", );
has legendrank => (
is => "rw",
isa => "Num",
documentation =>
"Sets the legend rank for this trace. Items and groups with smaller ranks are presented on top/left side while with `*reversed* `legend.traceorder` they are on bottom/right side. The default legendrank is 1000, so that you can use ranks less than 1000 to place certain items before all unranked items, and ranks greater than 1000 to go after all unranked items.",
);
has lon => ( is => "rw",
isa => "ArrayRef|PDL",
documentation => "Sets the longitude coordinates (in degrees East).",
);
has lonsrc => ( is => "rw",
isa => "Str",
documentation => "Sets the source reference on Chart Studio Cloud for `lon`.",
);
has pmeta => (
is => "rw",
isa => "Any|ArrayRef[Any]",
documentation =>
"Assigns extra meta information associated with this trace that can be used in various text attributes. Attributes such as trace `name`, graph, axis and colorbar `title.text`, annotation `text` `rangeselector`, `updatemenues` and `sliders` `label` text all support `meta`. To access the trace `meta` values in an attribute in the same trace, simply use `%{meta[i]}` where `i` is the index or key of the `meta` item in question. To access trace `meta` in layout attributes, use `%{data[n[.meta[i]}` where `i` is the index or key of the `meta` and `n` is the trace index.",
);
has metasrc => ( is => "rw",
isa => "Str",
documentation => "Sets the source reference on Chart Studio Cloud for `meta`.",
);
has name => ( is => "rw",
isa => "Str",
documentation => "Sets the trace name. The trace name appear as the legend item and on hover.",
);
has opacity => ( is => "rw",
isa => "Num",
documentation => "Sets the opacity of the trace.",
);
has radius => (
is => "rw",
isa => "Num|ArrayRef[Num]",
documentation =>
"Sets the radius of influence of one `lon` / `lat` point in pixels. Increasing the value makes the densitymapbox trace smoother, but less detailed.",
);
has radiussrc => ( is => "rw",
isa => "Str",
documentation => "Sets the source reference on Chart Studio Cloud for `radius`.",
);
has reversescale => (
is => "rw",
isa => "Bool",
documentation =>
"Reverses the color mapping if true. If true, `zmin` will correspond to the last color in the array and `zmax` will correspond to the first color.",
);
has showlegend => (
is => "rw",
isa => "Bool",
documentation => "Determines whether or not an item corresponding to this trace is shown in the legend.",
);
has showscale => ( is => "rw",
isa => "Bool",
documentation => "Determines whether or not a colorbar is displayed for this trace.",
);
has stream => ( is => "rw",
isa => "Maybe[HashRef]|Chart::Plotly::Trace::Densitymapbox::Stream", );
has subplot => (
is => "rw",
documentation =>
"Sets a reference between this trace's data coordinates and a mapbox subplot. If *mapbox* (the default value), the data refer to `layout.mapbox`. If *mapbox2*, the data refer to `layout.mapbox2`, and so on.",
);
has text => (
is => "rw",
isa => "Str|ArrayRef[Str]",
documentation =>
"Sets text elements associated with each (lon,lat) pair If a single string, the same string appears over all the data points. If an array of string, the items are mapped in order to the this trace's (lon,lat) coordinates. If trace `hoverinfo` contains a *text* flag and *hovertext* is not set, these elements will be seen in the hover labels.",
);
has textsrc => ( is => "rw",
isa => "Str",
documentation => "Sets the source reference on Chart Studio Cloud for `text`.",
);
has transforms => ( is => "rw",
isa => "ArrayRef|ArrayRef[Chart::Plotly::Trace::Densitymapbox::Transform]", );
has uid => (
is => "rw",
isa => "Str",
documentation =>
"Assign an id to this trace, Use this to provide object constancy between traces during animations and transitions.",
);
has uirevision => (
is => "rw",
isa => "Any",
documentation =>
"Controls persistence of some user-driven changes to the trace: `constraintrange` in `parcoords` traces, as well as some `editable: true` modifications such as `name` and `colorbar.title`. Defaults to `layout.uirevision`. Note that other user-driven trace attribute changes are controlled by `layout` attributes: `trace.visible` is controlled by `layout.legend.uirevision`, `selectedpoints` is controlled by `layout.selectionrevision`, and `colorbar.(x|y)` (accessible with `config: {editable: true}`) is controlled by `layout.editrevision`. Trace changes are tracked by `uid`, which only falls back on trace index if no `uid` is provided. So if your app can add/remove traces before the end of the `data` array, such that the same trace has a different index, you can still preserve user-driven changes if you give each trace a `uid` that stays with it as it moves.",
);
has visible => (
is => "rw",
documentation =>
"Determines whether or not this trace is visible. If *legendonly*, the trace is not drawn, but can appear as a legend item (provided that the legend itself is visible).",
);
has z => (
is => "rw",
isa => "ArrayRef|PDL",
documentation =>
"Sets the points' weight. For example, a value of 10 would be equivalent to having 10 points of weight 1 in the same spot",
);
has zauto => (
is => "rw",
isa => "Bool",
documentation =>
"Determines whether or not the color domain is computed with respect to the input data (here in `z`) or the bounds set in `zmin` and `zmax` Defaults to `false` when `zmin` and `zmax` are set by the user.",
);
has zmax => (
is => "rw",
isa => "Num",
documentation =>
"Sets the upper bound of the color domain. Value should have the same units as in `z` and if set, `zmin` must be set as well.",
);
has zmid => (
is => "rw",
isa => "Num",
documentation =>
"Sets the mid-point of the color domain by scaling `zmin` and/or `zmax` to be equidistant to this point. Value should have the same units as in `z`. Has no effect when `zauto` is `false`.",
);
has zmin => (
is => "rw",
isa => "Num",
documentation =>
"Sets the lower bound of the color domain. Value should have the same units as in `z` and if set, `zmax` must be set as well.",
);
has zsrc => ( is => "rw",
isa => "Str",
documentation => "Sets the source reference on Chart Studio Cloud for `z`.",
);
__PACKAGE__->meta->make_immutable();
1;
__END__
=pod
=encoding utf-8
=head1 NAME
Chart::Plotly::Trace::Densitymapbox - Draws a bivariate kernel density estimation with a Gaussian kernel from `lon` and `lat` coordinates and optional `z` values using a colorscale.
=head1 VERSION
version 0.042
=head1 SYNOPSIS
use Chart::Plotly;
use Chart::Plotly::Plot;
use JSON;
use Chart::Plotly::Trace::Densitymapbox;
# Example from https://github.com/plotly/plotly.js/blob/42998576f3ed1dd7f03bfcafd72627a0163bf605/test/image/mocks/mapbox_density0.json
my $trace1 = Chart::Plotly::Trace::Densitymapbox->new({'lon' => [10, 20, 30, ], 'z' => [1, 3, 2, ], 'lat' => [15, 25, 35, ], });
my $plot = Chart::Plotly::Plot->new(
traces => [$trace1, ],
layout =>
{'height' => 400, 'width' => 600, 'mapbox' => { 'style' => 'open-street-map'}}
);
Chart::Plotly::show_plot($plot);
=head1 DESCRIPTION
Draws a bivariate kernel density estimation with a Gaussian kernel from `lon` and `lat` coordinates and optional `z` values using a colorscale.
Screenshot of the above example:
=for HTML <p>
<img src="https://raw.githubusercontent.com/pablrod/p5-Chart-Plotly/master/examples/traces/densitymapbox.png" alt="Screenshot of the above example">
</p>
=for markdown 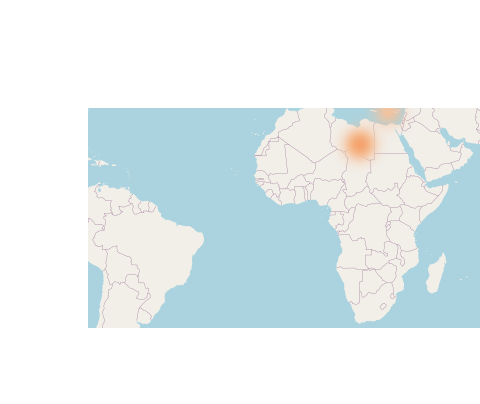
=for HTML <p>
<iframe src="https://raw.githubusercontent.com/pablrod/p5-Chart-Plotly/master/examples/traces/densitymapbox.html" style="border:none;" width="80%" height="520"></iframe>
</p>
This file has been autogenerated from the official plotly.js source.
If you like Plotly, please support them: L<https://plot.ly/>
Open source announcement: L<https://plot.ly/javascript/open-source-announcement/>
Full reference: L<https://plot.ly/javascript/reference/#densitymapbox>
=head1 DISCLAIMER
This is an unofficial Plotly Perl module. Currently I'm not affiliated in any way with Plotly.
But I think plotly.js is a great library and I want to use it with perl.
=head1 METHODS
=head2 TO_JSON
Serialize the trace to JSON. This method should be called only by L<JSON> serializer.
=head2 type
Trace type.
=head1 ATTRIBUTES
=over
=item * autocolorscale
Determines whether the colorscale is a default palette (`autocolorscale: true`) or the palette determined by `colorscale`. In case `colorscale` is unspecified or `autocolorscale` is true, the default palette will be chosen according to whether numbers in the `color` array are all positive, all negative or mixed.
=item * below
Determines if the densitymapbox trace will be inserted before the layer with the specified ID. By default, densitymapbox traces are placed below the first layer of type symbol If set to '', the layer will be inserted above every existing layer.
=item * coloraxis
Sets a reference to a shared color axis. References to these shared color axes are *coloraxis*, *coloraxis2*, *coloraxis3*, etc. Settings for these shared color axes are set in the layout, under `layout.coloraxis`, `layout.coloraxis2`, etc. Note that multiple color scales can be linked to the same color axis.
=item * colorbar
=item * colorscale
Sets the colorscale. The colorscale must be an array containing arrays mapping a normalized value to an rgb, rgba, hex, hsl, hsv, or named color string. At minimum, a mapping for the lowest (0) and highest (1) values are required. For example, `[[0, 'rgb(0,0,255)'], [1, 'rgb(255,0,0)']]`. To control the bounds of the colorscale in color space, use `zmin` and `zmax`. Alternatively, `colorscale` may be a palette name string of the following list: Blackbody,Bluered,Blues,Cividis,Earth,Electric,Greens,Greys,Hot,Jet,Picnic,Portland,Rainbow,RdBu,Reds,Viridis,YlGnBu,YlOrRd.
=item * customdata
Assigns extra data each datum. This may be useful when listening to hover, click and selection events. Note that, *scatter* traces also appends customdata items in the markers DOM elements
=item * customdatasrc
Sets the source reference on Chart Studio Cloud for `customdata`.
=item * hoverinfo
Determines which trace information appear on hover. If `none` or `skip` are set, no information is displayed upon hovering. But, if `none` is set, click and hover events are still fired.
=item * hoverinfosrc
Sets the source reference on Chart Studio Cloud for `hoverinfo`.
=item * hoverlabel
=item * hovertemplate
Template string used for rendering the information that appear on hover box. Note that this will override `hoverinfo`. Variables are inserted using %{variable}, for example "y: %{y}" as well as %{xother}, {%_xother}, {%_xother_}, {%xother_}. When showing info for several points, *xother* will be added to those with different x positions from the first point. An underscore before or after *(x|y)other* will add a space on that side, only when this field is shown. Numbers are formatted using d3-format's syntax %{variable:d3-format}, for example "Price: %{y:$.2f}". https://github.com/d3/d3-format/tree/v1.4.5#d3-format for details on the formatting syntax. Dates are formatted using d3-time-format's syntax %{variable|d3-time-format}, for example "Day: %{2019-01-01|%A}". https://github.com/d3/d3-time-format/tree/v2.2.3#locale_format for details on the date formatting syntax. The variables available in `hovertemplate` are the ones emitted as event data described at this link https://plotly.com/javascript/plotlyjs-events/#event-data. Additionally, every attributes that can be specified per-point (the ones that are `arrayOk: true`) are available. Anything contained in tag `<extra>` is displayed in the secondary box, for example "<extra>{fullData.name}</extra>". To hide the secondary box completely, use an empty tag `<extra></extra>`.
=item * hovertemplatesrc
Sets the source reference on Chart Studio Cloud for `hovertemplate`.
=item * hovertext
Sets hover text elements associated with each (lon,lat) pair If a single string, the same string appears over all the data points. If an array of string, the items are mapped in order to the this trace's (lon,lat) coordinates. To be seen, trace `hoverinfo` must contain a *text* flag.
=item * hovertextsrc
Sets the source reference on Chart Studio Cloud for `hovertext`.
=item * ids
Assigns id labels to each datum. These ids for object constancy of data points during animation. Should be an array of strings, not numbers or any other type.
=item * idssrc
Sets the source reference on Chart Studio Cloud for `ids`.
=item * lat
Sets the latitude coordinates (in degrees North).
=item * latsrc
Sets the source reference on Chart Studio Cloud for `lat`.
=item * legendgroup
Sets the legend group for this trace. Traces part of the same legend group hide/show at the same time when toggling legend items.
=item * legendgrouptitle
=item * legendrank
Sets the legend rank for this trace. Items and groups with smaller ranks are presented on top/left side while with `*reversed* `legend.traceorder` they are on bottom/right side. The default legendrank is 1000, so that you can use ranks less than 1000 to place certain items before all unranked items, and ranks greater than 1000 to go after all unranked items.
=item * lon
Sets the longitude coordinates (in degrees East).
=item * lonsrc
Sets the source reference on Chart Studio Cloud for `lon`.
=item * pmeta
Assigns extra meta information associated with this trace that can be used in various text attributes. Attributes such as trace `name`, graph, axis and colorbar `title.text`, annotation `text` `rangeselector`, `updatemenues` and `sliders` `label` text all support `meta`. To access the trace `meta` values in an attribute in the same trace, simply use `%{meta[i]}` where `i` is the index or key of the `meta` item in question. To access trace `meta` in layout attributes, use `%{data[n[.meta[i]}` where `i` is the index or key of the `meta` and `n` is the trace index.
=item * metasrc
Sets the source reference on Chart Studio Cloud for `meta`.
=item * name
Sets the trace name. The trace name appear as the legend item and on hover.
=item * opacity
Sets the opacity of the trace.
=item * radius
Sets the radius of influence of one `lon` / `lat` point in pixels. Increasing the value makes the densitymapbox trace smoother, but less detailed.
=item * radiussrc
Sets the source reference on Chart Studio Cloud for `radius`.
=item * reversescale
Reverses the color mapping if true. If true, `zmin` will correspond to the last color in the array and `zmax` will correspond to the first color.
=item * showlegend
Determines whether or not an item corresponding to this trace is shown in the legend.
=item * showscale
Determines whether or not a colorbar is displayed for this trace.
=item * stream
=item * subplot
Sets a reference between this trace's data coordinates and a mapbox subplot. If *mapbox* (the default value), the data refer to `layout.mapbox`. If *mapbox2*, the data refer to `layout.mapbox2`, and so on.
=item * text
Sets text elements associated with each (lon,lat) pair If a single string, the same string appears over all the data points. If an array of string, the items are mapped in order to the this trace's (lon,lat) coordinates. If trace `hoverinfo` contains a *text* flag and *hovertext* is not set, these elements will be seen in the hover labels.
=item * textsrc
Sets the source reference on Chart Studio Cloud for `text`.
=item * transforms
=item * uid
Assign an id to this trace, Use this to provide object constancy between traces during animations and transitions.
=item * uirevision
Controls persistence of some user-driven changes to the trace: `constraintrange` in `parcoords` traces, as well as some `editable: true` modifications such as `name` and `colorbar.title`. Defaults to `layout.uirevision`. Note that other user-driven trace attribute changes are controlled by `layout` attributes: `trace.visible` is controlled by `layout.legend.uirevision`, `selectedpoints` is controlled by `layout.selectionrevision`, and `colorbar.(x|y)` (accessible with `config: {editable: true}`) is controlled by `layout.editrevision`. Trace changes are tracked by `uid`, which only falls back on trace index if no `uid` is provided. So if your app can add/remove traces before the end of the `data` array, such that the same trace has a different index, you can still preserve user-driven changes if you give each trace a `uid` that stays with it as it moves.
=item * visible
Determines whether or not this trace is visible. If *legendonly*, the trace is not drawn, but can appear as a legend item (provided that the legend itself is visible).
=item * z
Sets the points' weight. For example, a value of 10 would be equivalent to having 10 points of weight 1 in the same spot
=item * zauto
Determines whether or not the color domain is computed with respect to the input data (here in `z`) or the bounds set in `zmin` and `zmax` Defaults to `false` when `zmin` and `zmax` are set by the user.
=item * zmax
Sets the upper bound of the color domain. Value should have the same units as in `z` and if set, `zmin` must be set as well.
=item * zmid
Sets the mid-point of the color domain by scaling `zmin` and/or `zmax` to be equidistant to this point. Value should have the same units as in `z`. Has no effect when `zauto` is `false`.
=item * zmin
Sets the lower bound of the color domain. Value should have the same units as in `z` and if set, `zmax` must be set as well.
=item * zsrc
Sets the source reference on Chart Studio Cloud for `z`.
=back
=head1 AUTHOR
Pablo Rodríguez González <pablo.rodriguez.gonzalez@gmail.com>
=head1 COPYRIGHT AND LICENSE
This software is Copyright (c) 2022 by Pablo Rodríguez González.
This is free software, licensed under:
The MIT (X11) License
=cut