Chart-Plotly/lib/Chart/Plotly/Trace/Heatmapgl.pm
package Chart::Plotly::Trace::Heatmapgl;
use Moose;
use MooseX::ExtraArgs;
use Moose::Util::TypeConstraints qw(enum union);
if ( !defined Moose::Util::TypeConstraints::find_type_constraint('PDL') ) {
Moose::Util::TypeConstraints::type('PDL');
}
use Chart::Plotly::Trace::Heatmapgl::Colorbar;
use Chart::Plotly::Trace::Heatmapgl::Hoverlabel;
use Chart::Plotly::Trace::Heatmapgl::Legendgrouptitle;
use Chart::Plotly::Trace::Heatmapgl::Stream;
use Chart::Plotly::Trace::Heatmapgl::Transform;
our $VERSION = '0.042'; # VERSION
# ABSTRACT: *heatmapgl* trace is deprecated! Please consider switching to the *heatmap* or *image* trace types. Alternatively you could contribute/sponsor rewriting this trace type based on cartesian features and using regl framework. WebGL version of the heatmap trace type.
sub TO_JSON {
my $self = shift;
my $extra_args = $self->extra_args // {};
my $meta = $self->meta;
my %hash = %$self;
for my $name ( sort keys %hash ) {
my $attr = $meta->get_attribute($name);
if ( defined $attr ) {
my $value = $hash{$name};
my $type = $attr->type_constraint;
if ( $type && $type->equals('Bool') ) {
$hash{$name} = $value ? \1 : \0;
}
}
}
my $plotly_meta = delete $hash{'pmeta'};
if ( defined $plotly_meta ) {
$hash{'meta'} = $plotly_meta;
}
%hash = ( %hash, %$extra_args );
delete $hash{'extra_args'};
if ( $self->can('type') && ( !defined $hash{'type'} ) ) {
$hash{type} = $self->type();
}
return \%hash;
}
sub type {
my @components = split( /::/, __PACKAGE__ );
return lc( $components[-1] );
}
has autocolorscale => (
is => "rw",
isa => "Bool",
documentation =>
"Determines whether the colorscale is a default palette (`autocolorscale: true`) or the palette determined by `colorscale`. In case `colorscale` is unspecified or `autocolorscale` is true, the default palette will be chosen according to whether numbers in the `color` array are all positive, all negative or mixed.",
);
has coloraxis => (
is => "rw",
documentation =>
"Sets a reference to a shared color axis. References to these shared color axes are *coloraxis*, *coloraxis2*, *coloraxis3*, etc. Settings for these shared color axes are set in the layout, under `layout.coloraxis`, `layout.coloraxis2`, etc. Note that multiple color scales can be linked to the same color axis.",
);
has colorbar => ( is => "rw",
isa => "Maybe[HashRef]|Chart::Plotly::Trace::Heatmapgl::Colorbar", );
has colorscale => (
is => "rw",
documentation =>
"Sets the colorscale. The colorscale must be an array containing arrays mapping a normalized value to an rgb, rgba, hex, hsl, hsv, or named color string. At minimum, a mapping for the lowest (0) and highest (1) values are required. For example, `[[0, 'rgb(0,0,255)'], [1, 'rgb(255,0,0)']]`. To control the bounds of the colorscale in color space, use `zmin` and `zmax`. Alternatively, `colorscale` may be a palette name string of the following list: Blackbody,Bluered,Blues,Cividis,Earth,Electric,Greens,Greys,Hot,Jet,Picnic,Portland,Rainbow,RdBu,Reds,Viridis,YlGnBu,YlOrRd.",
);
has customdata => (
is => "rw",
isa => "ArrayRef|PDL",
documentation =>
"Assigns extra data each datum. This may be useful when listening to hover, click and selection events. Note that, *scatter* traces also appends customdata items in the markers DOM elements",
);
has customdatasrc => ( is => "rw",
isa => "Str",
documentation => "Sets the source reference on Chart Studio Cloud for `customdata`.",
);
has dx => ( is => "rw",
isa => "Num",
documentation => "Sets the x coordinate step. See `x0` for more info.",
);
has dy => ( is => "rw",
isa => "Num",
documentation => "Sets the y coordinate step. See `y0` for more info.",
);
has hoverinfo => (
is => "rw",
isa => "Str|ArrayRef[Str]",
documentation =>
"Determines which trace information appear on hover. If `none` or `skip` are set, no information is displayed upon hovering. But, if `none` is set, click and hover events are still fired.",
);
has hoverinfosrc => ( is => "rw",
isa => "Str",
documentation => "Sets the source reference on Chart Studio Cloud for `hoverinfo`.",
);
has hoverlabel => ( is => "rw",
isa => "Maybe[HashRef]|Chart::Plotly::Trace::Heatmapgl::Hoverlabel", );
has ids => (
is => "rw",
isa => "ArrayRef|PDL",
documentation =>
"Assigns id labels to each datum. These ids for object constancy of data points during animation. Should be an array of strings, not numbers or any other type.",
);
has idssrc => ( is => "rw",
isa => "Str",
documentation => "Sets the source reference on Chart Studio Cloud for `ids`.",
);
has legendgrouptitle => ( is => "rw",
isa => "Maybe[HashRef]|Chart::Plotly::Trace::Heatmapgl::Legendgrouptitle", );
has legendrank => (
is => "rw",
isa => "Num",
documentation =>
"Sets the legend rank for this trace. Items and groups with smaller ranks are presented on top/left side while with `*reversed* `legend.traceorder` they are on bottom/right side. The default legendrank is 1000, so that you can use ranks less than 1000 to place certain items before all unranked items, and ranks greater than 1000 to go after all unranked items.",
);
has pmeta => (
is => "rw",
isa => "Any|ArrayRef[Any]",
documentation =>
"Assigns extra meta information associated with this trace that can be used in various text attributes. Attributes such as trace `name`, graph, axis and colorbar `title.text`, annotation `text` `rangeselector`, `updatemenues` and `sliders` `label` text all support `meta`. To access the trace `meta` values in an attribute in the same trace, simply use `%{meta[i]}` where `i` is the index or key of the `meta` item in question. To access trace `meta` in layout attributes, use `%{data[n[.meta[i]}` where `i` is the index or key of the `meta` and `n` is the trace index.",
);
has metasrc => ( is => "rw",
isa => "Str",
documentation => "Sets the source reference on Chart Studio Cloud for `meta`.",
);
has name => ( is => "rw",
isa => "Str",
documentation => "Sets the trace name. The trace name appear as the legend item and on hover.",
);
has opacity => ( is => "rw",
isa => "Num",
documentation => "Sets the opacity of the trace.",
);
has reversescale => (
is => "rw",
isa => "Bool",
documentation =>
"Reverses the color mapping if true. If true, `zmin` will correspond to the last color in the array and `zmax` will correspond to the first color.",
);
has showscale => ( is => "rw",
isa => "Bool",
documentation => "Determines whether or not a colorbar is displayed for this trace.",
);
has stream => ( is => "rw",
isa => "Maybe[HashRef]|Chart::Plotly::Trace::Heatmapgl::Stream", );
has text => ( is => "rw",
isa => "ArrayRef|PDL",
documentation => "Sets the text elements associated with each z value.",
);
has textsrc => ( is => "rw",
isa => "Str",
documentation => "Sets the source reference on Chart Studio Cloud for `text`.",
);
has transforms => ( is => "rw",
isa => "ArrayRef|ArrayRef[Chart::Plotly::Trace::Heatmapgl::Transform]", );
has transpose => ( is => "rw",
isa => "Bool",
documentation => "Transposes the z data.",
);
has uid => (
is => "rw",
isa => "Str",
documentation =>
"Assign an id to this trace, Use this to provide object constancy between traces during animations and transitions.",
);
has uirevision => (
is => "rw",
isa => "Any",
documentation =>
"Controls persistence of some user-driven changes to the trace: `constraintrange` in `parcoords` traces, as well as some `editable: true` modifications such as `name` and `colorbar.title`. Defaults to `layout.uirevision`. Note that other user-driven trace attribute changes are controlled by `layout` attributes: `trace.visible` is controlled by `layout.legend.uirevision`, `selectedpoints` is controlled by `layout.selectionrevision`, and `colorbar.(x|y)` (accessible with `config: {editable: true}`) is controlled by `layout.editrevision`. Trace changes are tracked by `uid`, which only falls back on trace index if no `uid` is provided. So if your app can add/remove traces before the end of the `data` array, such that the same trace has a different index, you can still preserve user-driven changes if you give each trace a `uid` that stays with it as it moves.",
);
has visible => (
is => "rw",
documentation =>
"Determines whether or not this trace is visible. If *legendonly*, the trace is not drawn, but can appear as a legend item (provided that the legend itself is visible).",
);
has x => ( is => "rw",
isa => "ArrayRef|PDL",
documentation => "Sets the x coordinates.",
);
has x0 => (
is => "rw",
isa => "Any",
documentation =>
"Alternate to `x`. Builds a linear space of x coordinates. Use with `dx` where `x0` is the starting coordinate and `dx` the step.",
);
has xaxis => (
is => "rw",
documentation =>
"Sets a reference between this trace's x coordinates and a 2D cartesian x axis. If *x* (the default value), the x coordinates refer to `layout.xaxis`. If *x2*, the x coordinates refer to `layout.xaxis2`, and so on.",
);
has xsrc => ( is => "rw",
isa => "Str",
documentation => "Sets the source reference on Chart Studio Cloud for `x`.",
);
has xtype => (
is => "rw",
isa => enum( [ "array", "scaled" ] ),
documentation =>
"If *array*, the heatmap's x coordinates are given by *x* (the default behavior when `x` is provided). If *scaled*, the heatmap's x coordinates are given by *x0* and *dx* (the default behavior when `x` is not provided).",
);
has y => ( is => "rw",
isa => "ArrayRef|PDL",
documentation => "Sets the y coordinates.",
);
has y0 => (
is => "rw",
isa => "Any",
documentation =>
"Alternate to `y`. Builds a linear space of y coordinates. Use with `dy` where `y0` is the starting coordinate and `dy` the step.",
);
has yaxis => (
is => "rw",
documentation =>
"Sets a reference between this trace's y coordinates and a 2D cartesian y axis. If *y* (the default value), the y coordinates refer to `layout.yaxis`. If *y2*, the y coordinates refer to `layout.yaxis2`, and so on.",
);
has ysrc => ( is => "rw",
isa => "Str",
documentation => "Sets the source reference on Chart Studio Cloud for `y`.",
);
has ytype => (
is => "rw",
isa => enum( [ "array", "scaled" ] ),
documentation =>
"If *array*, the heatmap's y coordinates are given by *y* (the default behavior when `y` is provided) If *scaled*, the heatmap's y coordinates are given by *y0* and *dy* (the default behavior when `y` is not provided)",
);
has z => ( is => "rw",
isa => "ArrayRef|PDL",
documentation => "Sets the z data.",
);
has zauto => (
is => "rw",
isa => "Bool",
documentation =>
"Determines whether or not the color domain is computed with respect to the input data (here in `z`) or the bounds set in `zmin` and `zmax` Defaults to `false` when `zmin` and `zmax` are set by the user.",
);
has zmax => (
is => "rw",
isa => "Num",
documentation =>
"Sets the upper bound of the color domain. Value should have the same units as in `z` and if set, `zmin` must be set as well.",
);
has zmid => (
is => "rw",
isa => "Num",
documentation =>
"Sets the mid-point of the color domain by scaling `zmin` and/or `zmax` to be equidistant to this point. Value should have the same units as in `z`. Has no effect when `zauto` is `false`.",
);
has zmin => (
is => "rw",
isa => "Num",
documentation =>
"Sets the lower bound of the color domain. Value should have the same units as in `z` and if set, `zmax` must be set as well.",
);
has zsmooth => ( is => "rw",
documentation => "Picks a smoothing algorithm use to smooth `z` data.", );
has zsrc => ( is => "rw",
isa => "Str",
documentation => "Sets the source reference on Chart Studio Cloud for `z`.",
);
__PACKAGE__->meta->make_immutable();
1;
__END__
=pod
=encoding utf-8
=head1 NAME
Chart::Plotly::Trace::Heatmapgl - *heatmapgl* trace is deprecated! Please consider switching to the *heatmap* or *image* trace types. Alternatively you could contribute/sponsor rewriting this trace type based on cartesian features and using regl framework. WebGL version of the heatmap trace type.
=head1 VERSION
version 0.042
=head1 SYNOPSIS
use Chart::Plotly qw(show_plot);
use Chart::Plotly::Trace::Heatmapgl;
use English qw(-no_match_vars);
my $heatmap = Chart::Plotly::Trace::Heatmapgl->new(
x => [ 0 .. 10 ],
y => [ 0 .. 10 ],
z => [
map {
my $y = $ARG;
[ map { $ARG * $ARG + $y * $y } ( 0 .. 10 ) ]
} ( 0 .. 10 )
]
);
show_plot( [$heatmap] );
=head1 DESCRIPTION
*heatmapgl* trace is deprecated! Please consider switching to the *heatmap* or *image* trace types. Alternatively you could contribute/sponsor rewriting this trace type based on cartesian features and using regl framework. WebGL version of the heatmap trace type.
Screenshot of the above example:
=for HTML <p>
<img src="https://raw.githubusercontent.com/pablrod/p5-Chart-Plotly/master/examples/traces/heatmapgl.png" alt="Screenshot of the above example">
</p>
=for markdown 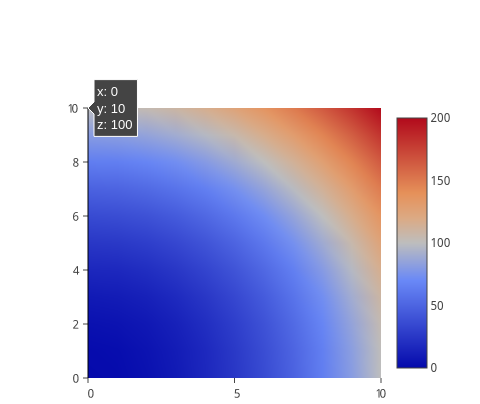
=for HTML <p>
<iframe src="https://raw.githubusercontent.com/pablrod/p5-Chart-Plotly/master/examples/traces/heatmapgl.html" style="border:none;" width="80%" height="520"></iframe>
</p>
This file has been autogenerated from the official plotly.js source.
If you like Plotly, please support them: L<https://plot.ly/>
Open source announcement: L<https://plot.ly/javascript/open-source-announcement/>
Full reference: L<https://plot.ly/javascript/reference/#heatmapgl>
=head1 DISCLAIMER
This is an unofficial Plotly Perl module. Currently I'm not affiliated in any way with Plotly.
But I think plotly.js is a great library and I want to use it with perl.
=head1 METHODS
=head2 TO_JSON
Serialize the trace to JSON. This method should be called only by L<JSON> serializer.
=head2 type
Trace type.
=head1 ATTRIBUTES
=over
=item * autocolorscale
Determines whether the colorscale is a default palette (`autocolorscale: true`) or the palette determined by `colorscale`. In case `colorscale` is unspecified or `autocolorscale` is true, the default palette will be chosen according to whether numbers in the `color` array are all positive, all negative or mixed.
=item * coloraxis
Sets a reference to a shared color axis. References to these shared color axes are *coloraxis*, *coloraxis2*, *coloraxis3*, etc. Settings for these shared color axes are set in the layout, under `layout.coloraxis`, `layout.coloraxis2`, etc. Note that multiple color scales can be linked to the same color axis.
=item * colorbar
=item * colorscale
Sets the colorscale. The colorscale must be an array containing arrays mapping a normalized value to an rgb, rgba, hex, hsl, hsv, or named color string. At minimum, a mapping for the lowest (0) and highest (1) values are required. For example, `[[0, 'rgb(0,0,255)'], [1, 'rgb(255,0,0)']]`. To control the bounds of the colorscale in color space, use `zmin` and `zmax`. Alternatively, `colorscale` may be a palette name string of the following list: Blackbody,Bluered,Blues,Cividis,Earth,Electric,Greens,Greys,Hot,Jet,Picnic,Portland,Rainbow,RdBu,Reds,Viridis,YlGnBu,YlOrRd.
=item * customdata
Assigns extra data each datum. This may be useful when listening to hover, click and selection events. Note that, *scatter* traces also appends customdata items in the markers DOM elements
=item * customdatasrc
Sets the source reference on Chart Studio Cloud for `customdata`.
=item * dx
Sets the x coordinate step. See `x0` for more info.
=item * dy
Sets the y coordinate step. See `y0` for more info.
=item * hoverinfo
Determines which trace information appear on hover. If `none` or `skip` are set, no information is displayed upon hovering. But, if `none` is set, click and hover events are still fired.
=item * hoverinfosrc
Sets the source reference on Chart Studio Cloud for `hoverinfo`.
=item * hoverlabel
=item * ids
Assigns id labels to each datum. These ids for object constancy of data points during animation. Should be an array of strings, not numbers or any other type.
=item * idssrc
Sets the source reference on Chart Studio Cloud for `ids`.
=item * legendgrouptitle
=item * legendrank
Sets the legend rank for this trace. Items and groups with smaller ranks are presented on top/left side while with `*reversed* `legend.traceorder` they are on bottom/right side. The default legendrank is 1000, so that you can use ranks less than 1000 to place certain items before all unranked items, and ranks greater than 1000 to go after all unranked items.
=item * pmeta
Assigns extra meta information associated with this trace that can be used in various text attributes. Attributes such as trace `name`, graph, axis and colorbar `title.text`, annotation `text` `rangeselector`, `updatemenues` and `sliders` `label` text all support `meta`. To access the trace `meta` values in an attribute in the same trace, simply use `%{meta[i]}` where `i` is the index or key of the `meta` item in question. To access trace `meta` in layout attributes, use `%{data[n[.meta[i]}` where `i` is the index or key of the `meta` and `n` is the trace index.
=item * metasrc
Sets the source reference on Chart Studio Cloud for `meta`.
=item * name
Sets the trace name. The trace name appear as the legend item and on hover.
=item * opacity
Sets the opacity of the trace.
=item * reversescale
Reverses the color mapping if true. If true, `zmin` will correspond to the last color in the array and `zmax` will correspond to the first color.
=item * showscale
Determines whether or not a colorbar is displayed for this trace.
=item * stream
=item * text
Sets the text elements associated with each z value.
=item * textsrc
Sets the source reference on Chart Studio Cloud for `text`.
=item * transforms
=item * transpose
Transposes the z data.
=item * uid
Assign an id to this trace, Use this to provide object constancy between traces during animations and transitions.
=item * uirevision
Controls persistence of some user-driven changes to the trace: `constraintrange` in `parcoords` traces, as well as some `editable: true` modifications such as `name` and `colorbar.title`. Defaults to `layout.uirevision`. Note that other user-driven trace attribute changes are controlled by `layout` attributes: `trace.visible` is controlled by `layout.legend.uirevision`, `selectedpoints` is controlled by `layout.selectionrevision`, and `colorbar.(x|y)` (accessible with `config: {editable: true}`) is controlled by `layout.editrevision`. Trace changes are tracked by `uid`, which only falls back on trace index if no `uid` is provided. So if your app can add/remove traces before the end of the `data` array, such that the same trace has a different index, you can still preserve user-driven changes if you give each trace a `uid` that stays with it as it moves.
=item * visible
Determines whether or not this trace is visible. If *legendonly*, the trace is not drawn, but can appear as a legend item (provided that the legend itself is visible).
=item * x
Sets the x coordinates.
=item * x0
Alternate to `x`. Builds a linear space of x coordinates. Use with `dx` where `x0` is the starting coordinate and `dx` the step.
=item * xaxis
Sets a reference between this trace's x coordinates and a 2D cartesian x axis. If *x* (the default value), the x coordinates refer to `layout.xaxis`. If *x2*, the x coordinates refer to `layout.xaxis2`, and so on.
=item * xsrc
Sets the source reference on Chart Studio Cloud for `x`.
=item * xtype
If *array*, the heatmap's x coordinates are given by *x* (the default behavior when `x` is provided). If *scaled*, the heatmap's x coordinates are given by *x0* and *dx* (the default behavior when `x` is not provided).
=item * y
Sets the y coordinates.
=item * y0
Alternate to `y`. Builds a linear space of y coordinates. Use with `dy` where `y0` is the starting coordinate and `dy` the step.
=item * yaxis
Sets a reference between this trace's y coordinates and a 2D cartesian y axis. If *y* (the default value), the y coordinates refer to `layout.yaxis`. If *y2*, the y coordinates refer to `layout.yaxis2`, and so on.
=item * ysrc
Sets the source reference on Chart Studio Cloud for `y`.
=item * ytype
If *array*, the heatmap's y coordinates are given by *y* (the default behavior when `y` is provided) If *scaled*, the heatmap's y coordinates are given by *y0* and *dy* (the default behavior when `y` is not provided)
=item * z
Sets the z data.
=item * zauto
Determines whether or not the color domain is computed with respect to the input data (here in `z`) or the bounds set in `zmin` and `zmax` Defaults to `false` when `zmin` and `zmax` are set by the user.
=item * zmax
Sets the upper bound of the color domain. Value should have the same units as in `z` and if set, `zmin` must be set as well.
=item * zmid
Sets the mid-point of the color domain by scaling `zmin` and/or `zmax` to be equidistant to this point. Value should have the same units as in `z`. Has no effect when `zauto` is `false`.
=item * zmin
Sets the lower bound of the color domain. Value should have the same units as in `z` and if set, `zmax` must be set as well.
=item * zsmooth
Picks a smoothing algorithm use to smooth `z` data.
=item * zsrc
Sets the source reference on Chart Studio Cloud for `z`.
=back
=head1 AUTHOR
Pablo Rodríguez González <pablo.rodriguez.gonzalez@gmail.com>
=head1 COPYRIGHT AND LICENSE
This software is Copyright (c) 2022 by Pablo Rodríguez González.
This is free software, licensed under:
The MIT (X11) License
=cut