Chart-Plotly/lib/Chart/Plotly/Trace/Parcats.pm
package Chart::Plotly::Trace::Parcats;
use Moose;
use MooseX::ExtraArgs;
use Moose::Util::TypeConstraints qw(enum union);
if ( !defined Moose::Util::TypeConstraints::find_type_constraint('PDL') ) {
Moose::Util::TypeConstraints::type('PDL');
}
use Chart::Plotly::Trace::Parcats::Dimension;
use Chart::Plotly::Trace::Parcats::Domain;
use Chart::Plotly::Trace::Parcats::Labelfont;
use Chart::Plotly::Trace::Parcats::Legendgrouptitle;
use Chart::Plotly::Trace::Parcats::Line;
use Chart::Plotly::Trace::Parcats::Stream;
use Chart::Plotly::Trace::Parcats::Tickfont;
use Chart::Plotly::Trace::Parcats::Transform;
our $VERSION = '0.042'; # VERSION
# ABSTRACT: Parallel categories diagram for multidimensional categorical data.
sub TO_JSON {
my $self = shift;
my $extra_args = $self->extra_args // {};
my $meta = $self->meta;
my %hash = %$self;
for my $name ( sort keys %hash ) {
my $attr = $meta->get_attribute($name);
if ( defined $attr ) {
my $value = $hash{$name};
my $type = $attr->type_constraint;
if ( $type && $type->equals('Bool') ) {
$hash{$name} = $value ? \1 : \0;
}
}
}
my $plotly_meta = delete $hash{'pmeta'};
if ( defined $plotly_meta ) {
$hash{'meta'} = $plotly_meta;
}
%hash = ( %hash, %$extra_args );
delete $hash{'extra_args'};
if ( $self->can('type') && ( !defined $hash{'type'} ) ) {
$hash{type} = $self->type();
}
return \%hash;
}
sub type {
my @components = split( /::/, __PACKAGE__ );
return lc( $components[-1] );
}
has arrangement => (
is => "rw",
isa => enum( [ "perpendicular", "freeform", "fixed" ] ),
documentation =>
"Sets the drag interaction mode for categories and dimensions. If `perpendicular`, the categories can only move along a line perpendicular to the paths. If `freeform`, the categories can freely move on the plane. If `fixed`, the categories and dimensions are stationary.",
);
has bundlecolors => ( is => "rw",
isa => "Bool",
documentation => "Sort paths so that like colors are bundled together within each category.",
);
has counts => (
is => "rw",
isa => "Num|ArrayRef[Num]",
documentation =>
"The number of observations represented by each state. Defaults to 1 so that each state represents one observation",
);
has countssrc => ( is => "rw",
isa => "Str",
documentation => "Sets the source reference on Chart Studio Cloud for `counts`.",
);
has dimensions => ( is => "rw",
isa => "ArrayRef|ArrayRef[Chart::Plotly::Trace::Parcats::Dimension]", );
has domain => ( is => "rw",
isa => "Maybe[HashRef]|Chart::Plotly::Trace::Parcats::Domain", );
has hoverinfo => (
is => "rw",
isa => "Str",
documentation =>
"Determines which trace information appear on hover. If `none` or `skip` are set, no information is displayed upon hovering. But, if `none` is set, click and hover events are still fired.",
);
has hoveron => (
is => "rw",
isa => enum( [ "category", "color", "dimension" ] ),
documentation =>
"Sets the hover interaction mode for the parcats diagram. If `category`, hover interaction take place per category. If `color`, hover interactions take place per color per category. If `dimension`, hover interactions take place across all categories per dimension.",
);
has hovertemplate => (
is => "rw",
isa => "Str",
documentation =>
"Template string used for rendering the information that appear on hover box. Note that this will override `hoverinfo`. Variables are inserted using %{variable}, for example \"y: %{y}\" as well as %{xother}, {%_xother}, {%_xother_}, {%xother_}. When showing info for several points, *xother* will be added to those with different x positions from the first point. An underscore before or after *(x|y)other* will add a space on that side, only when this field is shown. Numbers are formatted using d3-format's syntax %{variable:d3-format}, for example \"Price: %{y:\$.2f}\". https://github.com/d3/d3-format/tree/v1.4.5#d3-format for details on the formatting syntax. Dates are formatted using d3-time-format's syntax %{variable|d3-time-format}, for example \"Day: %{2019-01-01|%A}\". https://github.com/d3/d3-time-format/tree/v2.2.3#locale_format for details on the date formatting syntax. The variables available in `hovertemplate` are the ones emitted as event data described at this link https://plotly.com/javascript/plotlyjs-events/#event-data. Additionally, every attributes that can be specified per-point (the ones that are `arrayOk: true`) are available. variables `count`, `probability`, `category`, `categorycount`, `colorcount` and `bandcolorcount`. Anything contained in tag `<extra>` is displayed in the secondary box, for example \"<extra>{fullData.name}</extra>\". To hide the secondary box completely, use an empty tag `<extra></extra>`.",
);
has labelfont => ( is => "rw",
isa => "Maybe[HashRef]|Chart::Plotly::Trace::Parcats::Labelfont", );
has legendgrouptitle => ( is => "rw",
isa => "Maybe[HashRef]|Chart::Plotly::Trace::Parcats::Legendgrouptitle", );
has line => ( is => "rw",
isa => "Maybe[HashRef]|Chart::Plotly::Trace::Parcats::Line", );
has pmeta => (
is => "rw",
isa => "Any|ArrayRef[Any]",
documentation =>
"Assigns extra meta information associated with this trace that can be used in various text attributes. Attributes such as trace `name`, graph, axis and colorbar `title.text`, annotation `text` `rangeselector`, `updatemenues` and `sliders` `label` text all support `meta`. To access the trace `meta` values in an attribute in the same trace, simply use `%{meta[i]}` where `i` is the index or key of the `meta` item in question. To access trace `meta` in layout attributes, use `%{data[n[.meta[i]}` where `i` is the index or key of the `meta` and `n` is the trace index.",
);
has metasrc => ( is => "rw",
isa => "Str",
documentation => "Sets the source reference on Chart Studio Cloud for `meta`.",
);
has name => ( is => "rw",
isa => "Str",
documentation => "Sets the trace name. The trace name appear as the legend item and on hover.",
);
has sortpaths => (
is => "rw",
isa => enum( [ "forward", "backward" ] ),
documentation =>
"Sets the path sorting algorithm. If `forward`, sort paths based on dimension categories from left to right. If `backward`, sort paths based on dimensions categories from right to left.",
);
has stream => ( is => "rw",
isa => "Maybe[HashRef]|Chart::Plotly::Trace::Parcats::Stream", );
has tickfont => ( is => "rw",
isa => "Maybe[HashRef]|Chart::Plotly::Trace::Parcats::Tickfont", );
has transforms => ( is => "rw",
isa => "ArrayRef|ArrayRef[Chart::Plotly::Trace::Parcats::Transform]", );
has uid => (
is => "rw",
isa => "Str",
documentation =>
"Assign an id to this trace, Use this to provide object constancy between traces during animations and transitions.",
);
has uirevision => (
is => "rw",
isa => "Any",
documentation =>
"Controls persistence of some user-driven changes to the trace: `constraintrange` in `parcoords` traces, as well as some `editable: true` modifications such as `name` and `colorbar.title`. Defaults to `layout.uirevision`. Note that other user-driven trace attribute changes are controlled by `layout` attributes: `trace.visible` is controlled by `layout.legend.uirevision`, `selectedpoints` is controlled by `layout.selectionrevision`, and `colorbar.(x|y)` (accessible with `config: {editable: true}`) is controlled by `layout.editrevision`. Trace changes are tracked by `uid`, which only falls back on trace index if no `uid` is provided. So if your app can add/remove traces before the end of the `data` array, such that the same trace has a different index, you can still preserve user-driven changes if you give each trace a `uid` that stays with it as it moves.",
);
has visible => (
is => "rw",
documentation =>
"Determines whether or not this trace is visible. If *legendonly*, the trace is not drawn, but can appear as a legend item (provided that the legend itself is visible).",
);
__PACKAGE__->meta->make_immutable();
1;
__END__
=pod
=encoding utf-8
=head1 NAME
Chart::Plotly::Trace::Parcats - Parallel categories diagram for multidimensional categorical data.
=head1 VERSION
version 0.042
=head1 SYNOPSIS
use Chart::Plotly;
use Chart::Plotly::Trace::Parcats;
use Chart::Plotly::Plot;
# Example from https://github.com/plotly/plotly.js/blob/7b751009fc9804272316f0bb539ed0386c0858bd/test/image/mocks/parcats_bundled.json
my $trace = Chart::Plotly::Trace::Parcats->new( bundlecolors => 1,
dimensions => [
{ label => 'One',
values => [ (1) x 2, 2, 1, 2, (1) x 2, 2, 1 ]
},
{ label => 'Two',
values => [ 'A', 'B', 'A', 'B', ('C') x 2, 'A', 'B', 'C' ]
},
{ label => 'Three',
values => [ (11) x 9 ]
}
],
domain => { x => [ 0.125, 0.625 ],
y => [ 0.25, 0.75 ]
},
line => { color => [ (0) x 2, (1) x 2, 0, 1, (0) x 3 ] }
);
my $plot = Chart::Plotly::Plot->new( traces => [$trace],
layout => { height => 602,
margin => { b => 40,
l => 40,
r => 40,
t => 50
},
width => 592
}
);
Chart::Plotly::show_plot($plot);
=head1 DESCRIPTION
Parallel categories diagram for multidimensional categorical data.
Screenshot of the above example:
=for HTML <p>
<img src="https://raw.githubusercontent.com/pablrod/p5-Chart-Plotly/master/examples/traces/parcats.png" alt="Screenshot of the above example">
</p>
=for markdown 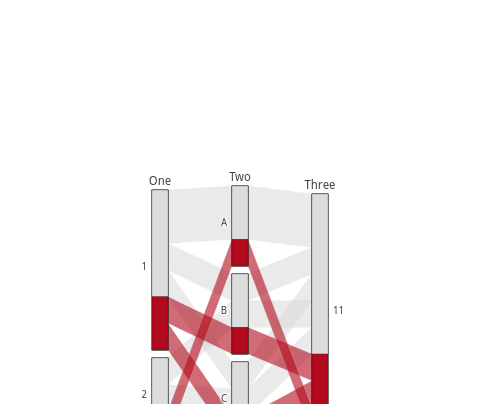
=for HTML <p>
<iframe src="https://raw.githubusercontent.com/pablrod/p5-Chart-Plotly/master/examples/traces/parcats.html" style="border:none;" width="80%" height="520"></iframe>
</p>
This file has been autogenerated from the official plotly.js source.
If you like Plotly, please support them: L<https://plot.ly/>
Open source announcement: L<https://plot.ly/javascript/open-source-announcement/>
Full reference: L<https://plot.ly/javascript/reference/#parcats>
=head1 DISCLAIMER
This is an unofficial Plotly Perl module. Currently I'm not affiliated in any way with Plotly.
But I think plotly.js is a great library and I want to use it with perl.
=head1 METHODS
=head2 TO_JSON
Serialize the trace to JSON. This method should be called only by L<JSON> serializer.
=head2 type
Trace type.
=head1 ATTRIBUTES
=over
=item * arrangement
Sets the drag interaction mode for categories and dimensions. If `perpendicular`, the categories can only move along a line perpendicular to the paths. If `freeform`, the categories can freely move on the plane. If `fixed`, the categories and dimensions are stationary.
=item * bundlecolors
Sort paths so that like colors are bundled together within each category.
=item * counts
The number of observations represented by each state. Defaults to 1 so that each state represents one observation
=item * countssrc
Sets the source reference on Chart Studio Cloud for `counts`.
=item * dimensions
=item * domain
=item * hoverinfo
Determines which trace information appear on hover. If `none` or `skip` are set, no information is displayed upon hovering. But, if `none` is set, click and hover events are still fired.
=item * hoveron
Sets the hover interaction mode for the parcats diagram. If `category`, hover interaction take place per category. If `color`, hover interactions take place per color per category. If `dimension`, hover interactions take place across all categories per dimension.
=item * hovertemplate
Template string used for rendering the information that appear on hover box. Note that this will override `hoverinfo`. Variables are inserted using %{variable}, for example "y: %{y}" as well as %{xother}, {%_xother}, {%_xother_}, {%xother_}. When showing info for several points, *xother* will be added to those with different x positions from the first point. An underscore before or after *(x|y)other* will add a space on that side, only when this field is shown. Numbers are formatted using d3-format's syntax %{variable:d3-format}, for example "Price: %{y:$.2f}". https://github.com/d3/d3-format/tree/v1.4.5#d3-format for details on the formatting syntax. Dates are formatted using d3-time-format's syntax %{variable|d3-time-format}, for example "Day: %{2019-01-01|%A}". https://github.com/d3/d3-time-format/tree/v2.2.3#locale_format for details on the date formatting syntax. The variables available in `hovertemplate` are the ones emitted as event data described at this link https://plotly.com/javascript/plotlyjs-events/#event-data. Additionally, every attributes that can be specified per-point (the ones that are `arrayOk: true`) are available. variables `count`, `probability`, `category`, `categorycount`, `colorcount` and `bandcolorcount`. Anything contained in tag `<extra>` is displayed in the secondary box, for example "<extra>{fullData.name}</extra>". To hide the secondary box completely, use an empty tag `<extra></extra>`.
=item * labelfont
=item * legendgrouptitle
=item * line
=item * pmeta
Assigns extra meta information associated with this trace that can be used in various text attributes. Attributes such as trace `name`, graph, axis and colorbar `title.text`, annotation `text` `rangeselector`, `updatemenues` and `sliders` `label` text all support `meta`. To access the trace `meta` values in an attribute in the same trace, simply use `%{meta[i]}` where `i` is the index or key of the `meta` item in question. To access trace `meta` in layout attributes, use `%{data[n[.meta[i]}` where `i` is the index or key of the `meta` and `n` is the trace index.
=item * metasrc
Sets the source reference on Chart Studio Cloud for `meta`.
=item * name
Sets the trace name. The trace name appear as the legend item and on hover.
=item * sortpaths
Sets the path sorting algorithm. If `forward`, sort paths based on dimension categories from left to right. If `backward`, sort paths based on dimensions categories from right to left.
=item * stream
=item * tickfont
=item * transforms
=item * uid
Assign an id to this trace, Use this to provide object constancy between traces during animations and transitions.
=item * uirevision
Controls persistence of some user-driven changes to the trace: `constraintrange` in `parcoords` traces, as well as some `editable: true` modifications such as `name` and `colorbar.title`. Defaults to `layout.uirevision`. Note that other user-driven trace attribute changes are controlled by `layout` attributes: `trace.visible` is controlled by `layout.legend.uirevision`, `selectedpoints` is controlled by `layout.selectionrevision`, and `colorbar.(x|y)` (accessible with `config: {editable: true}`) is controlled by `layout.editrevision`. Trace changes are tracked by `uid`, which only falls back on trace index if no `uid` is provided. So if your app can add/remove traces before the end of the `data` array, such that the same trace has a different index, you can still preserve user-driven changes if you give each trace a `uid` that stays with it as it moves.
=item * visible
Determines whether or not this trace is visible. If *legendonly*, the trace is not drawn, but can appear as a legend item (provided that the legend itself is visible).
=back
=head1 AUTHOR
Pablo Rodríguez González <pablo.rodriguez.gonzalez@gmail.com>
=head1 COPYRIGHT AND LICENSE
This software is Copyright (c) 2022 by Pablo Rodríguez González.
This is free software, licensed under:
The MIT (X11) License
=cut