Chart-Plotly/lib/Chart/Plotly/Trace/Sankey.pm
package Chart::Plotly::Trace::Sankey;
use Moose;
use MooseX::ExtraArgs;
use Moose::Util::TypeConstraints qw(enum union);
if ( !defined Moose::Util::TypeConstraints::find_type_constraint('PDL') ) {
Moose::Util::TypeConstraints::type('PDL');
}
use Chart::Plotly::Trace::Sankey::Domain;
use Chart::Plotly::Trace::Sankey::Hoverlabel;
use Chart::Plotly::Trace::Sankey::Legendgrouptitle;
use Chart::Plotly::Trace::Sankey::Link;
use Chart::Plotly::Trace::Sankey::Node;
use Chart::Plotly::Trace::Sankey::Stream;
use Chart::Plotly::Trace::Sankey::Textfont;
our $VERSION = '0.042'; # VERSION
# ABSTRACT: Sankey plots for network flow data analysis. The nodes are specified in `nodes` and the links between sources and targets in `links`. The colors are set in `nodes[i].color` and `links[i].color`, otherwise defaults are used.
sub TO_JSON {
my $self = shift;
my $extra_args = $self->extra_args // {};
my $meta = $self->meta;
my %hash = %$self;
for my $name ( sort keys %hash ) {
my $attr = $meta->get_attribute($name);
if ( defined $attr ) {
my $value = $hash{$name};
my $type = $attr->type_constraint;
if ( $type && $type->equals('Bool') ) {
$hash{$name} = $value ? \1 : \0;
}
}
}
my $plotly_meta = delete $hash{'pmeta'};
if ( defined $plotly_meta ) {
$hash{'meta'} = $plotly_meta;
}
%hash = ( %hash, %$extra_args );
delete $hash{'extra_args'};
if ( $self->can('type') && ( !defined $hash{'type'} ) ) {
$hash{type} = $self->type();
}
return \%hash;
}
sub type {
my @components = split( /::/, __PACKAGE__ );
return lc( $components[-1] );
}
has arrangement => (
is => "rw",
isa => enum( [ "snap", "perpendicular", "freeform", "fixed" ] ),
documentation =>
"If value is `snap` (the default), the node arrangement is assisted by automatic snapping of elements to preserve space between nodes specified via `nodepad`. If value is `perpendicular`, the nodes can only move along a line perpendicular to the flow. If value is `freeform`, the nodes can freely move on the plane. If value is `fixed`, the nodes are stationary.",
);
has customdata => (
is => "rw",
isa => "ArrayRef|PDL",
documentation =>
"Assigns extra data each datum. This may be useful when listening to hover, click and selection events. Note that, *scatter* traces also appends customdata items in the markers DOM elements",
);
has customdatasrc => ( is => "rw",
isa => "Str",
documentation => "Sets the source reference on Chart Studio Cloud for `customdata`.",
);
has domain => ( is => "rw",
isa => "Maybe[HashRef]|Chart::Plotly::Trace::Sankey::Domain", );
has hoverinfo => (
is => "rw",
isa => "Str",
documentation =>
"Determines which trace information appear on hover. If `none` or `skip` are set, no information is displayed upon hovering. But, if `none` is set, click and hover events are still fired. Note that this attribute is superseded by `node.hoverinfo` and `node.hoverinfo` for nodes and links respectively.",
);
has hoverlabel => ( is => "rw",
isa => "Maybe[HashRef]|Chart::Plotly::Trace::Sankey::Hoverlabel", );
has ids => (
is => "rw",
isa => "ArrayRef|PDL",
documentation =>
"Assigns id labels to each datum. These ids for object constancy of data points during animation. Should be an array of strings, not numbers or any other type.",
);
has idssrc => ( is => "rw",
isa => "Str",
documentation => "Sets the source reference on Chart Studio Cloud for `ids`.",
);
has legendgrouptitle => ( is => "rw",
isa => "Maybe[HashRef]|Chart::Plotly::Trace::Sankey::Legendgrouptitle", );
has legendrank => (
is => "rw",
isa => "Num",
documentation =>
"Sets the legend rank for this trace. Items and groups with smaller ranks are presented on top/left side while with `*reversed* `legend.traceorder` they are on bottom/right side. The default legendrank is 1000, so that you can use ranks less than 1000 to place certain items before all unranked items, and ranks greater than 1000 to go after all unranked items.",
);
has link => ( is => "rw",
isa => "Maybe[HashRef]|Chart::Plotly::Trace::Sankey::Link", );
has pmeta => (
is => "rw",
isa => "Any|ArrayRef[Any]",
documentation =>
"Assigns extra meta information associated with this trace that can be used in various text attributes. Attributes such as trace `name`, graph, axis and colorbar `title.text`, annotation `text` `rangeselector`, `updatemenues` and `sliders` `label` text all support `meta`. To access the trace `meta` values in an attribute in the same trace, simply use `%{meta[i]}` where `i` is the index or key of the `meta` item in question. To access trace `meta` in layout attributes, use `%{data[n[.meta[i]}` where `i` is the index or key of the `meta` and `n` is the trace index.",
);
has metasrc => ( is => "rw",
isa => "Str",
documentation => "Sets the source reference on Chart Studio Cloud for `meta`.",
);
has name => ( is => "rw",
isa => "Str",
documentation => "Sets the trace name. The trace name appear as the legend item and on hover.",
);
has node => ( is => "rw",
isa => "Maybe[HashRef]|Chart::Plotly::Trace::Sankey::Node", );
has orientation => ( is => "rw",
isa => enum( [ "v", "h" ] ),
documentation => "Sets the orientation of the Sankey diagram.",
);
has selectedpoints => (
is => "rw",
isa => "Any",
documentation =>
"Array containing integer indices of selected points. Has an effect only for traces that support selections. Note that an empty array means an empty selection where the `unselected` are turned on for all points, whereas, any other non-array values means no selection all where the `selected` and `unselected` styles have no effect.",
);
has stream => ( is => "rw",
isa => "Maybe[HashRef]|Chart::Plotly::Trace::Sankey::Stream", );
has textfont => ( is => "rw",
isa => "Maybe[HashRef]|Chart::Plotly::Trace::Sankey::Textfont", );
has uid => (
is => "rw",
isa => "Str",
documentation =>
"Assign an id to this trace, Use this to provide object constancy between traces during animations and transitions.",
);
has uirevision => (
is => "rw",
isa => "Any",
documentation =>
"Controls persistence of some user-driven changes to the trace: `constraintrange` in `parcoords` traces, as well as some `editable: true` modifications such as `name` and `colorbar.title`. Defaults to `layout.uirevision`. Note that other user-driven trace attribute changes are controlled by `layout` attributes: `trace.visible` is controlled by `layout.legend.uirevision`, `selectedpoints` is controlled by `layout.selectionrevision`, and `colorbar.(x|y)` (accessible with `config: {editable: true}`) is controlled by `layout.editrevision`. Trace changes are tracked by `uid`, which only falls back on trace index if no `uid` is provided. So if your app can add/remove traces before the end of the `data` array, such that the same trace has a different index, you can still preserve user-driven changes if you give each trace a `uid` that stays with it as it moves.",
);
has valueformat => (
is => "rw",
isa => "Str",
documentation =>
"Sets the value formatting rule using d3 formatting mini-languages which are very similar to those in Python. For numbers, see: https://github.com/d3/d3-format/tree/v1.4.5#d3-format.",
);
has valuesuffix => (
is => "rw",
isa => "Str",
documentation =>
"Adds a unit to follow the value in the hover tooltip. Add a space if a separation is necessary from the value.",
);
has visible => (
is => "rw",
documentation =>
"Determines whether or not this trace is visible. If *legendonly*, the trace is not drawn, but can appear as a legend item (provided that the legend itself is visible).",
);
__PACKAGE__->meta->make_immutable();
1;
__END__
=pod
=encoding utf-8
=head1 NAME
Chart::Plotly::Trace::Sankey - Sankey plots for network flow data analysis. The nodes are specified in `nodes` and the links between sources and targets in `links`. The colors are set in `nodes[i].color` and `links[i].color`, otherwise defaults are used.
=head1 VERSION
version 0.042
=head1 SYNOPSIS
use Chart::Plotly qw(show_plot);
use Chart::Plotly::Trace::Sankey;
# Example data from: https://plot.ly/javascript/sankey-diagram/#basic-sankey-diagram
my $sankey = Chart::Plotly::Trace::Sankey->new(
orientation => "h",
node => {
pad => 15,
thickness => 30,
line => {
color => "black",
width => 0.5
},
label => [ "A1", "A2", "B1", "B2", "C1", "C2" ],
color => [ "blue", "blue", "blue", "blue", "blue", "blue" ]
},
link => {
source => [ 0, 1, 0, 2, 3, 3 ],
target => [ 2, 3, 3, 4, 4, 5 ],
value => [ 8, 4, 2, 8, 4, 2 ]
}
);
show_plot([ $sankey ]);
=head1 DESCRIPTION
Sankey plots for network flow data analysis. The nodes are specified in `nodes` and the links between sources and targets in `links`. The colors are set in `nodes[i].color` and `links[i].color`, otherwise defaults are used.
Screenshot of the above example:
=for HTML <p>
<img src="https://raw.githubusercontent.com/pablrod/p5-Chart-Plotly/master/examples/traces/sankey.png" alt="Screenshot of the above example">
</p>
=for markdown 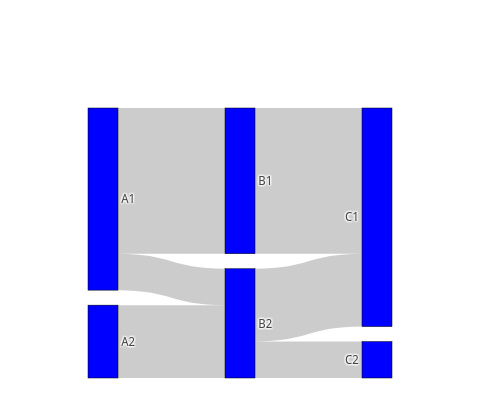
=for HTML <p>
<iframe src="https://raw.githubusercontent.com/pablrod/p5-Chart-Plotly/master/examples/traces/sankey.html" style="border:none;" width="80%" height="520"></iframe>
</p>
This file has been autogenerated from the official plotly.js source.
If you like Plotly, please support them: L<https://plot.ly/>
Open source announcement: L<https://plot.ly/javascript/open-source-announcement/>
Full reference: L<https://plot.ly/javascript/reference/#sankey>
=head1 DISCLAIMER
This is an unofficial Plotly Perl module. Currently I'm not affiliated in any way with Plotly.
But I think plotly.js is a great library and I want to use it with perl.
=head1 METHODS
=head2 TO_JSON
Serialize the trace to JSON. This method should be called only by L<JSON> serializer.
=head2 type
Trace type.
=head1 ATTRIBUTES
=over
=item * arrangement
If value is `snap` (the default), the node arrangement is assisted by automatic snapping of elements to preserve space between nodes specified via `nodepad`. If value is `perpendicular`, the nodes can only move along a line perpendicular to the flow. If value is `freeform`, the nodes can freely move on the plane. If value is `fixed`, the nodes are stationary.
=item * customdata
Assigns extra data each datum. This may be useful when listening to hover, click and selection events. Note that, *scatter* traces also appends customdata items in the markers DOM elements
=item * customdatasrc
Sets the source reference on Chart Studio Cloud for `customdata`.
=item * domain
=item * hoverinfo
Determines which trace information appear on hover. If `none` or `skip` are set, no information is displayed upon hovering. But, if `none` is set, click and hover events are still fired. Note that this attribute is superseded by `node.hoverinfo` and `node.hoverinfo` for nodes and links respectively.
=item * hoverlabel
=item * ids
Assigns id labels to each datum. These ids for object constancy of data points during animation. Should be an array of strings, not numbers or any other type.
=item * idssrc
Sets the source reference on Chart Studio Cloud for `ids`.
=item * legendgrouptitle
=item * legendrank
Sets the legend rank for this trace. Items and groups with smaller ranks are presented on top/left side while with `*reversed* `legend.traceorder` they are on bottom/right side. The default legendrank is 1000, so that you can use ranks less than 1000 to place certain items before all unranked items, and ranks greater than 1000 to go after all unranked items.
=item * link
=item * pmeta
Assigns extra meta information associated with this trace that can be used in various text attributes. Attributes such as trace `name`, graph, axis and colorbar `title.text`, annotation `text` `rangeselector`, `updatemenues` and `sliders` `label` text all support `meta`. To access the trace `meta` values in an attribute in the same trace, simply use `%{meta[i]}` where `i` is the index or key of the `meta` item in question. To access trace `meta` in layout attributes, use `%{data[n[.meta[i]}` where `i` is the index or key of the `meta` and `n` is the trace index.
=item * metasrc
Sets the source reference on Chart Studio Cloud for `meta`.
=item * name
Sets the trace name. The trace name appear as the legend item and on hover.
=item * node
=item * orientation
Sets the orientation of the Sankey diagram.
=item * selectedpoints
Array containing integer indices of selected points. Has an effect only for traces that support selections. Note that an empty array means an empty selection where the `unselected` are turned on for all points, whereas, any other non-array values means no selection all where the `selected` and `unselected` styles have no effect.
=item * stream
=item * textfont
=item * uid
Assign an id to this trace, Use this to provide object constancy between traces during animations and transitions.
=item * uirevision
Controls persistence of some user-driven changes to the trace: `constraintrange` in `parcoords` traces, as well as some `editable: true` modifications such as `name` and `colorbar.title`. Defaults to `layout.uirevision`. Note that other user-driven trace attribute changes are controlled by `layout` attributes: `trace.visible` is controlled by `layout.legend.uirevision`, `selectedpoints` is controlled by `layout.selectionrevision`, and `colorbar.(x|y)` (accessible with `config: {editable: true}`) is controlled by `layout.editrevision`. Trace changes are tracked by `uid`, which only falls back on trace index if no `uid` is provided. So if your app can add/remove traces before the end of the `data` array, such that the same trace has a different index, you can still preserve user-driven changes if you give each trace a `uid` that stays with it as it moves.
=item * valueformat
Sets the value formatting rule using d3 formatting mini-languages which are very similar to those in Python. For numbers, see: https://github.com/d3/d3-format/tree/v1.4.5#d3-format.
=item * valuesuffix
Adds a unit to follow the value in the hover tooltip. Add a space if a separation is necessary from the value.
=item * visible
Determines whether or not this trace is visible. If *legendonly*, the trace is not drawn, but can appear as a legend item (provided that the legend itself is visible).
=back
=head1 AUTHOR
Pablo Rodríguez González <pablo.rodriguez.gonzalez@gmail.com>
=head1 COPYRIGHT AND LICENSE
This software is Copyright (c) 2022 by Pablo Rodríguez González.
This is free software, licensed under:
The MIT (X11) License
=cut